GBP USD Forecast Today, 9 October 2026: The Four Hour Closed For Just Over Half Its Risk
Executive Summary
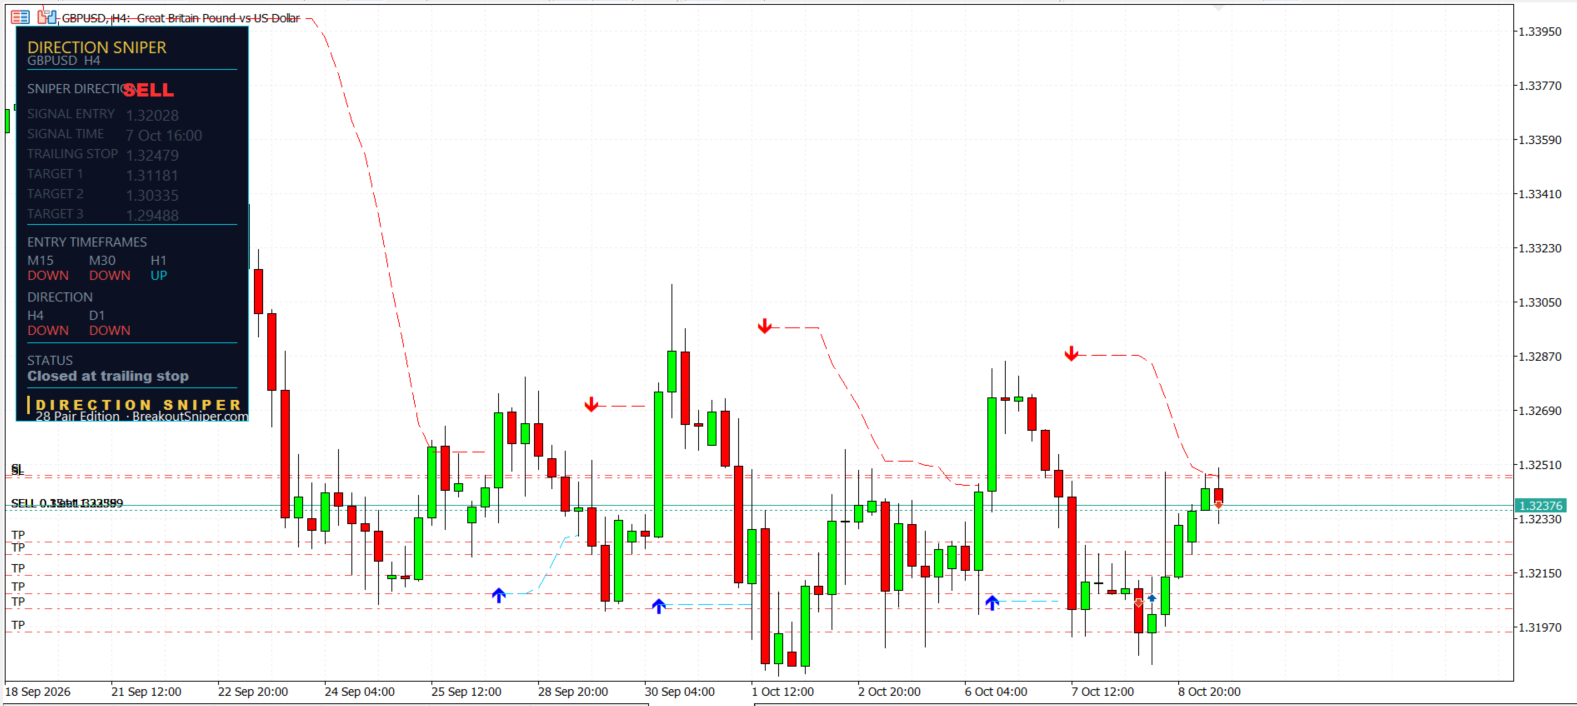
Yesterday we published the four hour ticket on this pair and said plainly that it was carrying the full 84.7 pips, that its level still read STOP LOSS rather than TRAILING STOP, and that nothing had trailed at all.
Today it closed.
GBP USD is trading at 1.32402.
| Chart | Entry | Risk | Where it stands |
|---|---|---|---|
| H4 | 1.32028, 7 Oct 16:00 | 84.7 pips | Closed at trailing stop 1.32479. Cost 45.1 |
| H1 | UP | none | no ticket, waiting for alignment |
| M30 | 1.32338, 10:00 today | 12.8 pips | 6.4 pips behind |
| M15 | 1.32364, 09:15 today | 11.1 pips | 3.8 pips behind |
A four hour position that has finished, two fresh tickets that are both currently behind, and one chart with nothing to say.
Why we publish this. Every entry, stop and target below is a level the indicator printed on a live chart, at the moment it printed, before price did anything about it. Nothing is back tested. Nothing is chosen after the fact. We publish the tickets that worked and the ones that did not, because a page that only shows you the winners teaches you nothing you can use. The point is to show how the panel is read and how position size follows from a stop. These are not trade recommendations and nothing here is financial advice.
One more thing you can see on the charts. The order line marked SELL on the four hour and one hour panels is one of our own live positions on this pair, on the same side as the verdict. We leave it on the images rather than cropping it out. It is not a recommendation and it is not a model portfolio.
1. It Cost 45.1 Pips Instead Of 84.7
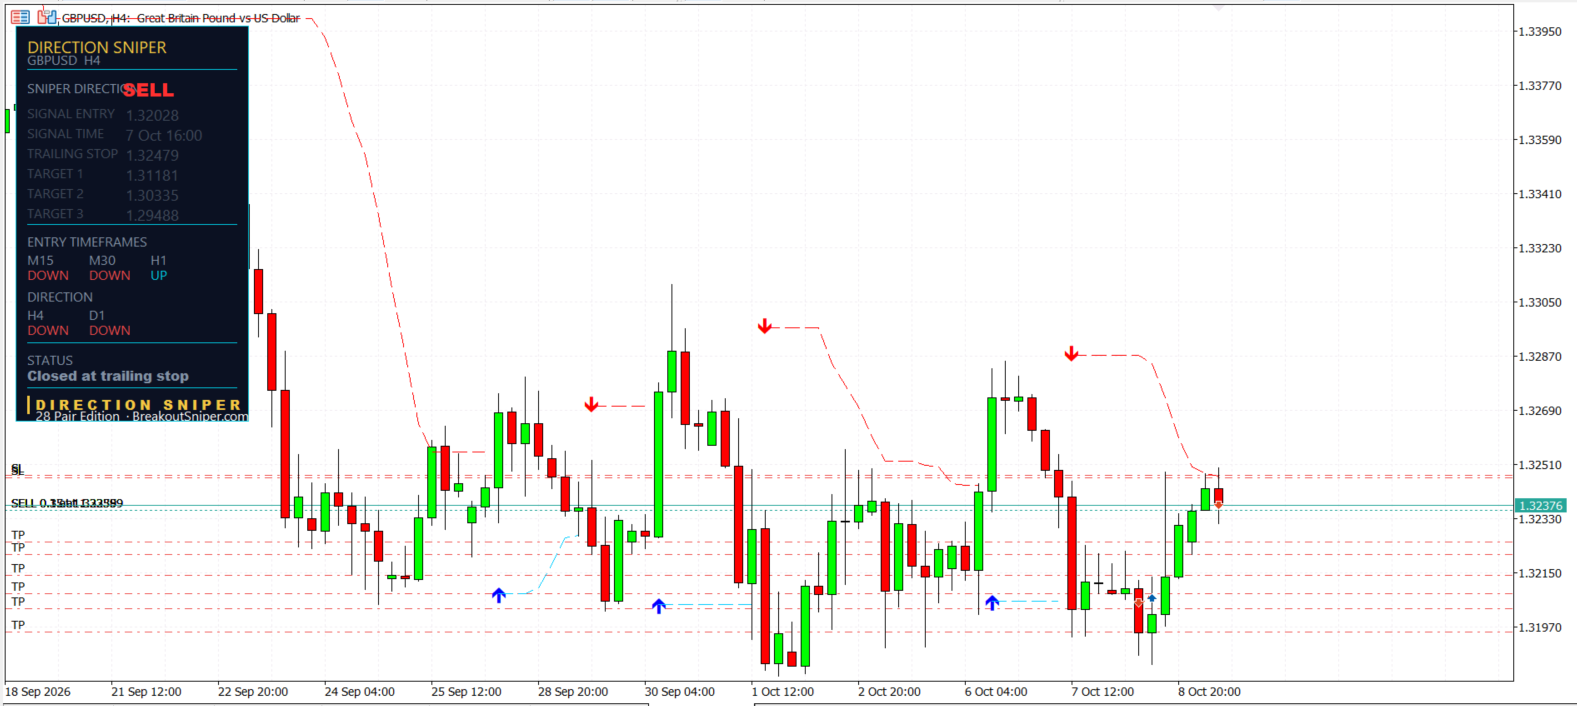
Here is the ticket from entry to close.
| Level | |
|---|---|
| Entry, sell | 1.32028, 7 October at 16:00 |
| Original stop | 1.32875, so 84.7 pips of risk |
| Targets | 1.31181, 1.30335, 1.29488, none reached |
| Closed at trailing stop | 1.32479 |
| Cost | 45.1 pips |
The level walked 39.6 pips in from where it started before price came back for it.
So a position placed risking 84.7 pips finished at just over half that, on a trade that reached none of its three targets. The trade was wrong. What it cost was 53 percent of what it was willing to lose.
On a ten thousand dollar account at half a percent, 84.7 pips allows 0.05 lots. At that size, the original stop was $42.35 and the actual cost was $22.55.
What the tool does for you here: the level is recalculated as structure tightens, and the label changes from STOP LOSS to TRAILING STOP the moment it starts moving. Yesterday that label still read STOP LOSS and we said so in print. Today it had moved 39.6 pips. You could watch the whole thing happen without doing any arithmetic yourself.
2. Why It Still Cost Money
This ticket is a clean example of something most traders have never had explained properly.
1.32479 is above the 1.32028 entry. On a sell, that means the level never crossed the entry price.
A trailing stop has two phases. Until the level crosses your entry it is limiting a loss, the same job an ordinary stop does, just at a shorter distance. Only after it crosses does it start holding on to a result.
This one never got there. It spent its entire life in the first phase, which is why “closed at trailing stop” on that panel means 45.1 pips gone rather than anything banked.
If that distinction is new, it is worth ten minutes. We have written it up with four real tickets in our guide to when to move your stop loss to break even.
3. The Part We Are Not Going To Hide
Price is 1.32402 right now. The entry was 1.32028.
Held to this moment, that position would be 37.4 pips down instead of the 45.1 it actually cost. So the trailing level took it out about 8 pips worse than simply sitting there would have been, so far.
Two things are true at once.
It was wrong either way. Price is above the entry on a sell. Holding is not a rescue, it is a smaller loss that is still a loss, and still open to getting larger.
The original stop was never reached. 1.32875 sits 47 pips above where price is now. A trader carrying the untrailed level still has the entire 84.7 pips exposed with no idea when it resolves.
Trailing costs you something on days like this and saves you something on most others. We publish both halves because the only version worth reading has both in it.
4. Two Replacements, 2.6 Pips Apart
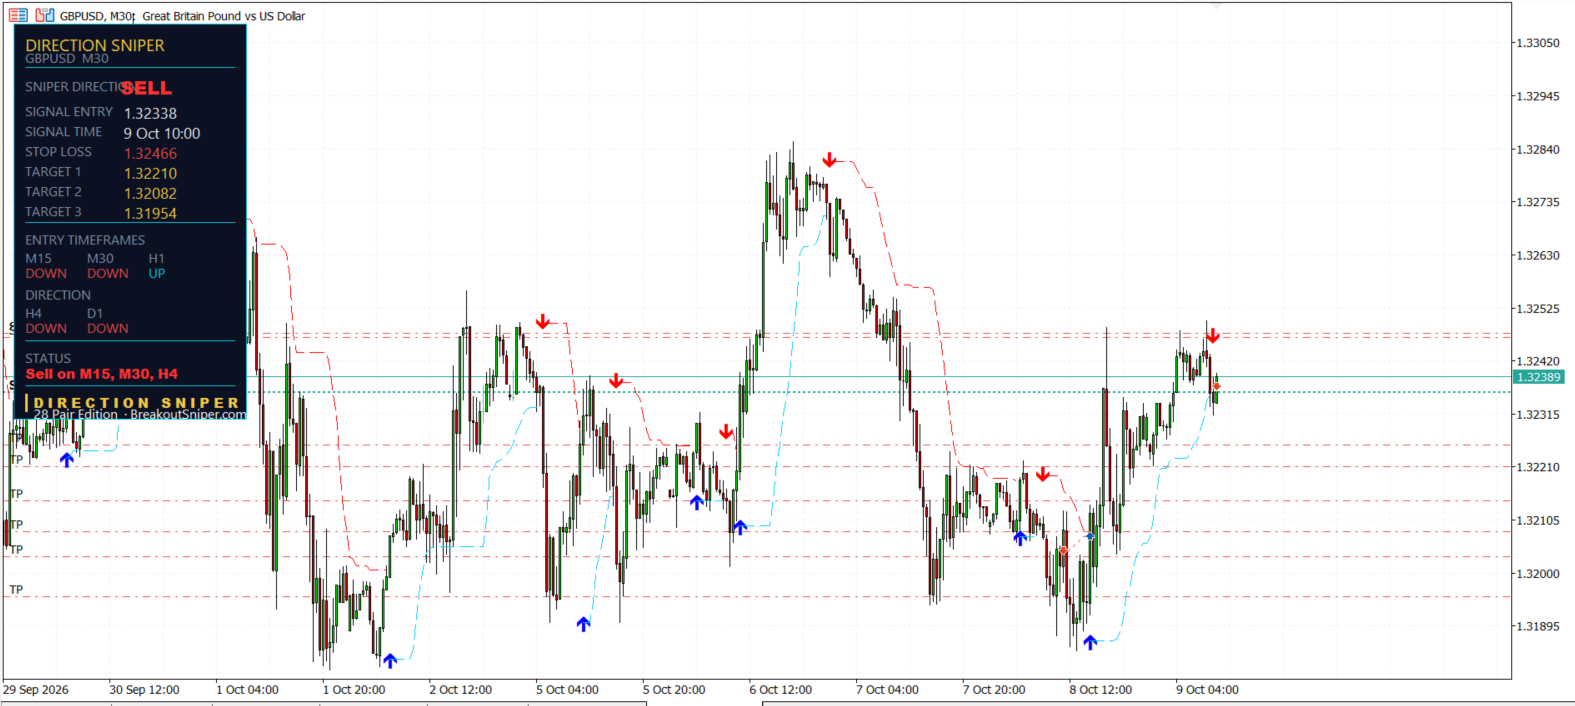
While the four hour was being closed out, the shorter charts came into position. First the fifteen minute, then the thirty minute forty five minutes later.
| M15 | M30 | |
|---|---|---|
| Entry | 1.32364 | 1.32338 |
| Signal time | 09:15 | 10:00 |
| Stop | 1.32475 | 1.32466 |
| Risk | 11.1 pips | 12.8 pips |
| Targets | 1.32253, 1.32143, 1.32032 | 1.32210, 1.32082, 1.31954 |
Look at those two stops. 1.32475 and 1.32466, which is 0.9 pips apart. Almost the same level, arrived at independently, from entries 2.6 pips apart.
That is worth pausing on, because yesterday on this same pair we published two tickets whose stops sat 6.1 pips apart, and that gap decided which one survived a rally and which one closed. Today the two levels have converged onto effectively the same price. The charts agree about where this idea stops being right.
Both entered higher than the four hour that just died. The fifteen minute by 33.6 pips, the thirty minute by 31.0. Same direction, better price, a fraction of the risk.
5. Both Are Behind. Here Is Which One Is In More Trouble.
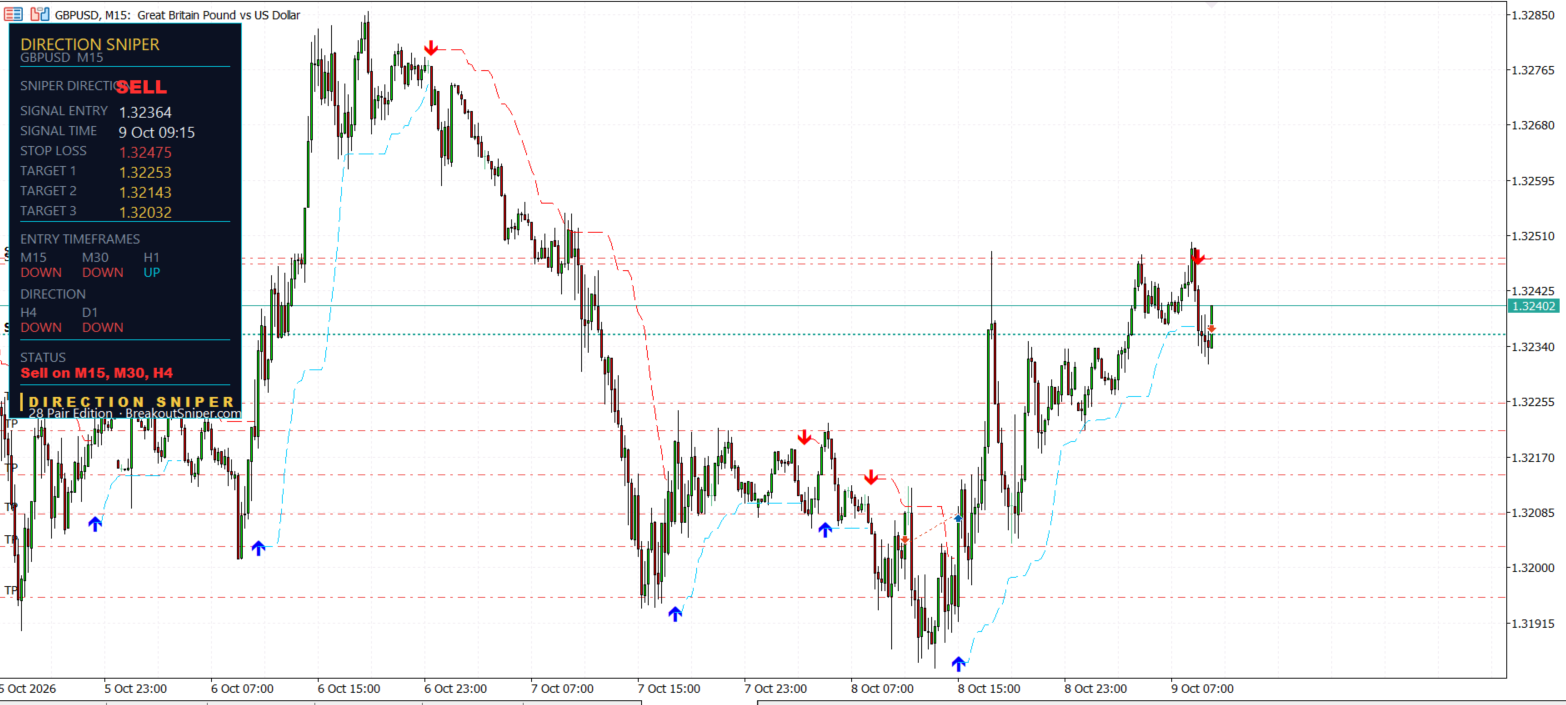
Neither of those tickets is working yet. We are not going to dress that up.
But “both behind” is not a useful description, and the measure that is useful has nothing to do with how many pips you are down.
Divide the distance from your entry to the current price by the distance from your entry to your stop. That is the fraction of your own risk you have spent, and it is the only number that compares two different trades fairly.
| M15 | M30 | |
|---|---|---|
| Entry | 1.32364 | 1.32338 |
| Price | 1.32402 | 1.32402 |
| Behind by | 3.8 pips | 6.4 pips |
| Its own stop | 11.1 pips | 12.8 pips |
| Risk spent | 34% | 50% |
The thirty minute is sitting at exactly half its stop. Price at 1.32402 is the precise midpoint between its 1.32338 entry and its 1.32466 stop.
The fifteen minute, which is only 2.6 pips away on the chart, has spent a third.
Those are two meaningfully different situations, and the pip counts alone would never have told you. A trade that is 6 pips down on a 12 pip stop is in a very different place from one that is 6 pips down on a 40 pip stop, and traders who watch the money instead of the fraction get this wrong constantly.
What the tool does for you here: every ticket arrives with its own stop in pips, so the fraction is a one line calculation rather than a guess. Without that number you are comparing two trades by how much they hurt, which is not information.
6. The One Hour Has Nothing To Say
The one hour points up this morning while the verdict is to sell, so it carries no ticket.
Not a weaker signal, not a warning. The panel will not build a sell on a chart currently pointing the other way, so it issues no entry, no stop and no targets, and waits for alignment.
Yesterday all five timeframes on this pair agreed and four tickets were on the board. This morning the shorter charts turned up on the overnight bounce, then the fifteen minute and the thirty minute came back down and issued tickets while the one hour did not.
What the tool does for you here: a blank chart is an answer. The temptation with two tickets already live is to find a third, and the one hour simply is not in position.
7. What The Lot Size Looks Like
Three different stop distances on one pair today, which means three different position sizes for identical money at risk.
On a ten thousand dollar account risking half a percent, which is fifty dollars, at ten dollars per pip per standard lot:
| Ticket | Risk | Lot size | Money at risk |
|---|---|---|---|
| M15 | 11.1 pips | 0.45 | $49.95 |
| M30 | 12.8 pips | 0.39 | $49.92 |
| The H4 that closed | 84.7 pips | 0.05 | $42.35 |
Note the first two. Entries 2.6 pips apart, stops 0.9 pips apart, and still a 15 percent difference in position size, because the risk differs by 1.7 pips. Nobody eyeballs that correctly.
And the four hour at one ninth the size of the fifteen minute is why its 45.1 pip close was a manageable event. Sized from its own stop it was never carrying more than half a percent, and it finished at about a quarter of one percent.
The stop distance decides the lot size. The lot size decides whether a wrong trade is an event or a problem. That order never reverses.
Where The Levels Sit Now
With GBP USD at 1.32402:
M30 stop at 1.32466 is 6.4 pips above price and M15 stop at 1.32475 is 7.3 pips above. Those two levels sit almost on top of each other and are the live risk on the board this morning.
Below price, the M15 first target at 1.32253 is 14.9 pips away, the M30 first target at 1.32210 is 19.2 away, then the M15 second at 1.32143 and the M30 second at 1.32082.
Further down, the M15 third target at 1.32032 and the M30 third at 1.31954.
Above everything, 1.32479 is where the four hour ticket closed, now history rather than a level to trade against, and the untrailed four hour stop at 1.32875 sits 47 pips above price.
Those are the levels on the chart and how far price sits from each. None of it is a forecast.
What You Are Actually Buying
A level that keeps moving while you are not watching it. Yesterday that four hour stop sat at 1.32875 and read STOP LOSS. Today it closed the position at 1.32479. Those 39.6 pips accrued quietly over two days.
A label that tells you which phase you are in. STOP LOSS means you are still carrying your original risk. TRAILING STOP means the level has begun moving. That one word is the difference between a position that can still cost you and one holding on to something.
A measured stop on every chart, in pips. 11.1, 12.8 and 84.7 on one pair today. That spread is why the position sizes differ by nine times, and it is also what lets you work out which of two losing trades is actually in trouble.
And the panel still running when a chart has nothing to say, which is how you avoid inventing a third trade on a morning that only has two.
Direction Sniper prints all of it on your charts in MetaTrader and keeps it live. You still move the order on your platform yourself. The indicator does the arithmetic, the click is yours.
- 28 Pair Edition, $77, every major, minor and cross, which is the edition these panels came from
- Forex Majors Edition, $47, the seven majors including GBP USD
- Gold and Silver Edition, the original and still the one most of our traders run
- EURUSD Edition, $7, the cheapest way to put the panel on a chart and watch it work for yourself
Worth reading next. Yesterday’s post, where this same four hour ticket was described as barely started while it was still open, and our guide to when to move your stop loss to break even, which explains why a level that never crosses your entry still costs you money.
One question. On your current open trade, what fraction of your own stop have you spent? Most people know the money and not the fraction. Tell us on the reviews and feedback page.
GBP USD Today: Common Questions
Is GBP USD a buy or a sell today?
On 9 October 2026 the Direction Sniper panel reads SELL on GBP USD. The daily and the four hour both point down, which sets the verdict, and the fifteen minute and thirty minute point down with them. The one hour still points up, so it carries no ticket. Two tickets are live on the shorter charts and the four hour ticket from 7 October has closed at its trailing stop. This describes what the indicator displays and is not a recommendation to trade.
What happened to the GBP USD four hour trade?
It closed at its trailing stop of 1.32479. The ticket entered at 1.32028 on 7 October with its stop at 1.32875, which is 84.7 pips of risk, and reached none of its three targets at 1.31181, 1.30335 and 1.29488. The level walked 39.6 pips in before price came back for it, so the position cost 45.1 pips, which is 53 percent of what it was risking.
Why did the trailing stop still cost money?
Because the level never crossed the entry price. On a sell, 1.32479 sits above the 1.32028 entry, which means the stop spent its entire life limiting a loss rather than holding a gain. A trailing stop only begins protecting a result once it has passed your entry, and until then it is doing the ordinary job of a stop loss at a shorter distance. This one closed in that first phase.
Would holding the four hour trade have been better?
On this one trade, at this moment, slightly. Price is 1.32402 against an entry of 1.32028, so a position held to now would be 37.4 pips down rather than the 45.1 it cost, a difference of about 8 pips. Two things stay true alongside that. It was a losing position either way, since price sits above the entry on a sell. And the original stop at 1.32875 was never reached, so a trader carrying the untrailed level still has the full 84.7 pips exposed.
How do you tell which of two losing trades is in more trouble?
Not by the pips, but by the fraction of its own stop each one has spent. Divide the distance from the entry to the current price by the distance from the entry to the stop. Today the GBP USD fifteen minute entered at 1.32364 and is 3.8 pips behind on an 11.1 pip stop, which is 34 percent, while the thirty minute entered at 1.32338 and is 6.4 pips behind on a 12.8 pip stop, which is exactly 50 percent. Two tickets entered 2.6 pips apart on the same pair, in meaningfully different positions, and the pip counts alone would not have told you.
Why is there no GBP USD signal on the 1 hour chart today?
Because it points up while the verdict is to sell. The panel will not build a sell ticket on a timeframe pointing the other way, so it issues no entry, no stop and no targets and waits for alignment. The overnight bounce turned all three entry charts up. The fifteen minute and the thirty minute have since turned back down and issued tickets, and the one hour has not.
What are the GBP USD key levels today?
With GBP USD at 1.32402, the two live stops sit almost on top of each other, the thirty minute at 1.32466 and the fifteen minute at 1.32475, which is 6.4 and 7.3 pips above price. Below price, the fifteen minute first target at 1.32253 is nearest, then the thirty minute first at 1.32210, the fifteen minute second at 1.32143 and the thirty minute second at 1.32082. Above everything, 1.32479 is where the four hour ticket closed and the untrailed four hour stop sits at 1.32875.
What lot size should you use on GBP USD today?
It depends on the ticket, because each carries its own stop. On a ten thousand dollar account risking half a percent, which is fifty dollars, at ten dollars per pip per standard lot, the fifteen minute stop of 11.1 pips allows about 0.45 lots and the thirty minute stop of 12.8 pips allows 0.39. Those two entered 2.6 pips apart with stops 0.9 pips apart and still differ in size by 15 percent. The four hour that closed carried an 84.7 pip stop, which allowed 0.05 lots, one ninth of the fifteen minute.
Trading foreign exchange, gold and other leveraged products carries a high level of risk and is not suitable for everyone. The levels above describe where the indicator placed entries, stops and targets at the time the charts were read, and the status shown for each ticket is the status the panel displayed at that moment. The four panels were read within a few minutes of each other and the price used throughout is the most recent of those reads. Distances between an entry and a closing level are arithmetic on published levels and are not a statement of anyone’s result, which depends on position size, spread, slippage and how each trader manages an order. Figures describing what a closed position would have done if it had been held are hypothetical. The position marked on the charts is one of our own and is shown for transparency rather than as a recommendation or a model portfolio. The fifteen minute and thirty minute positions were still open, so their outcomes are not known. A stop is a level rather than a guarantee, and gaps or fast markets can fill you past it. Trailing a stop reduces the worst case on a position but also closes positions that may later have recovered. Lot sizing figures are arithmetic for illustration and are not a recommendation about how much anyone should trade. Nothing here is financial advice. Past performance does not guarantee future results.

