GBP USD Forecast Today, 8 October 2026: Two Tickets Entered Almost Together. Why Only One Is Still Open.
Executive Summary
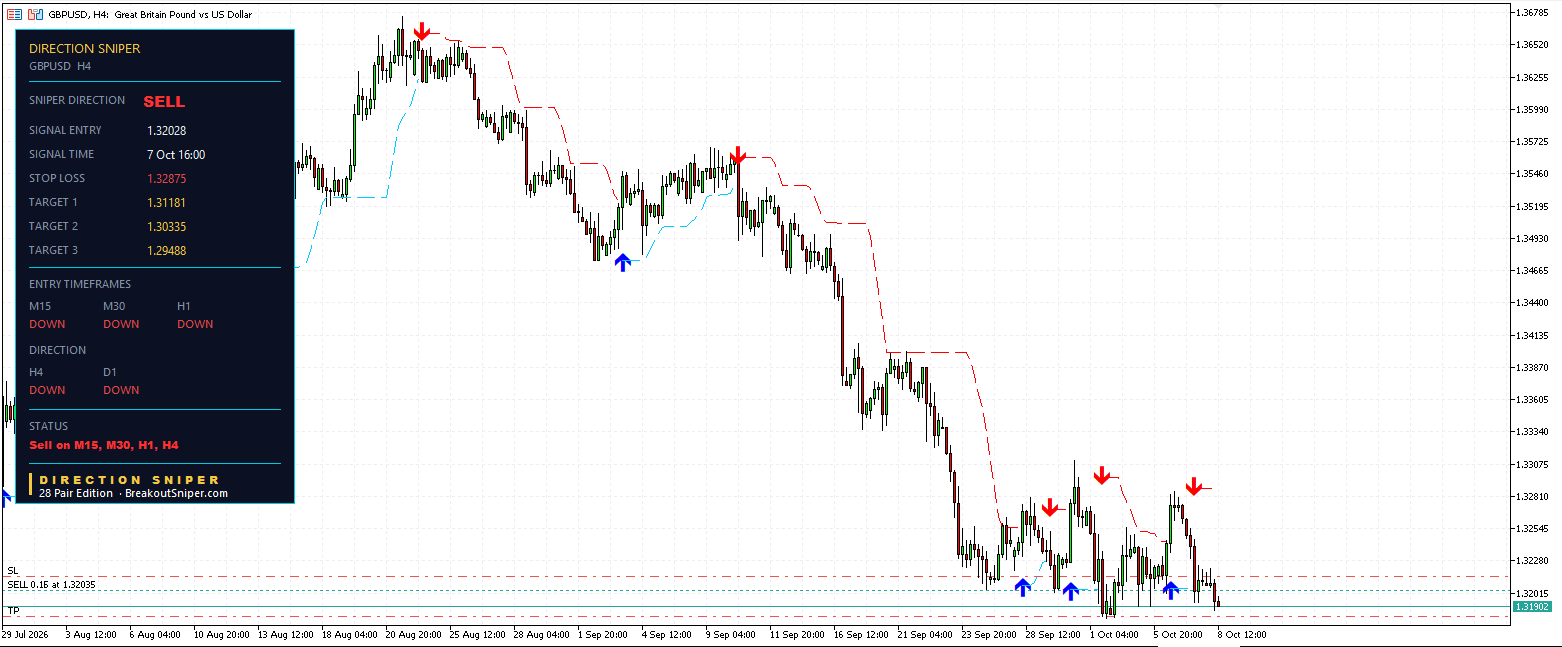
Every timeframe on GBP USD is pointing the same way this morning. Daily down, four hour down, and all three entry charts down with them. Nothing is waiting, nothing disagrees.
GBP USD is trading at 1.31918.
| Chart | Entry | Signal time | Risk | Where it stands |
|---|---|---|---|---|
| H4 | 1.32028 | 7 Oct 16:00 | 84.7 pips | 11.0 pips ahead, 13% toward T1 |
| H1 | 1.32625 | 7 Oct 04:00 | 20.2 pips | All three targets reached |
| M30 | 1.32070 | 8 Oct 08:30 | 12.3 pips | T1 reached, still open |
| M15 | 1.32052 | 8 Oct 08:45 | 8.4 pips | T1 and T2 reached, closed at trailing stop |
Four tickets, one direction, four completely different stages. One finished, one barely started, one running and one closed, all in the same market at the same moment.
The pair worth studying is the bottom two.
A note on the charts. The line you can see marked SELL 0.16 at 1.32035 on every panel is one of our own live positions, on the same side as everything described here. We have left it on the images rather than cropping it out. It is not a recommendation and it is not a model portfolio, it is simply what was on the screen when the charts were read.
1. Fifteen Minutes And 1.8 Pips Apart
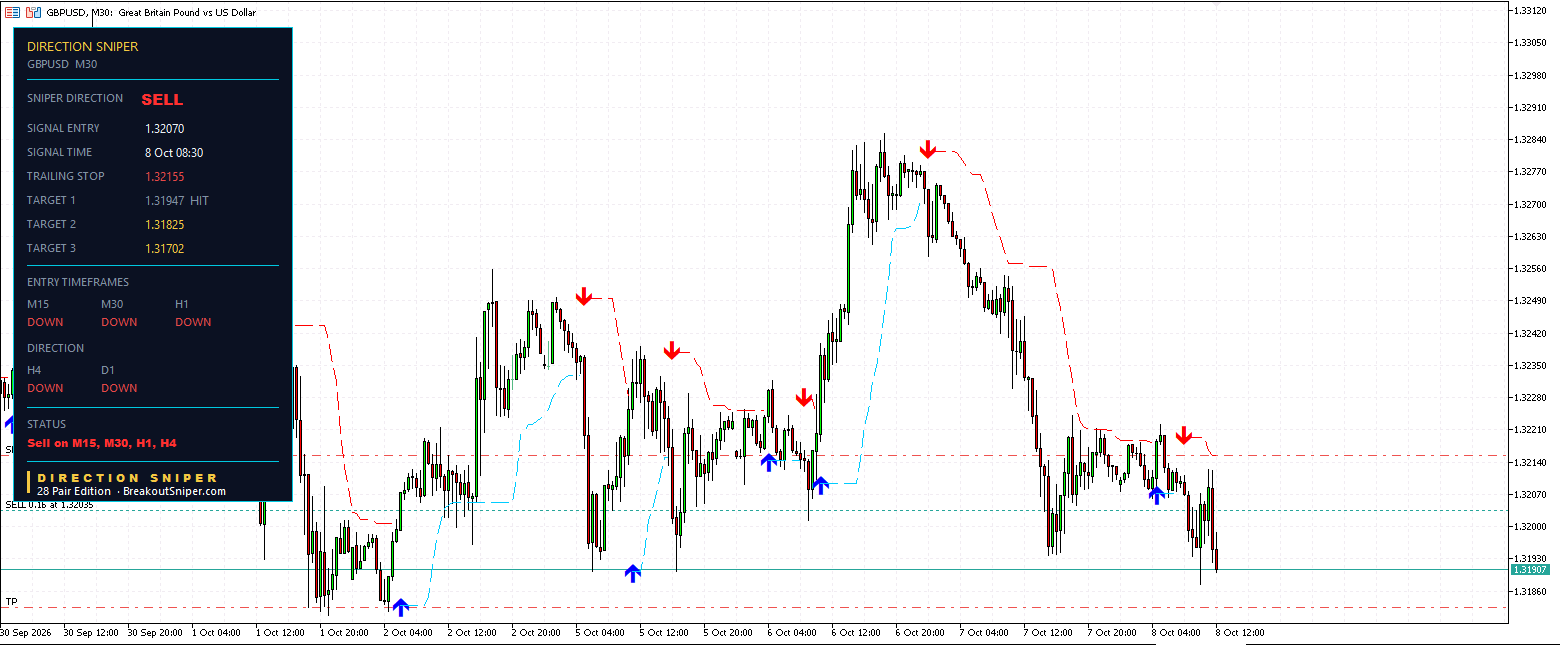
Look at the two newest tickets.
| M15 | M30 | |
|---|---|---|
| Entry | 1.32052 | 1.32070 |
| Signal time | 08:45 | 08:30 |
| Risk | 8.4 pips | 12.3 pips |
| Targets | 1.31968, 1.31883, 1.31799 | 1.31947, 1.31825, 1.31702 |
| Status | Closed at trailing stop | Still open |
Fifteen minutes apart. 1.8 pips apart on entry. Same pair, same direction, same morning, same verdict above them.
One of them is finished and one of them is still working.
Nothing about the market separated those two trades. Nothing about timing, or conviction, or the pattern on the chart. The only difference was how far away the stop was.
2. The Six Pips That Decided It
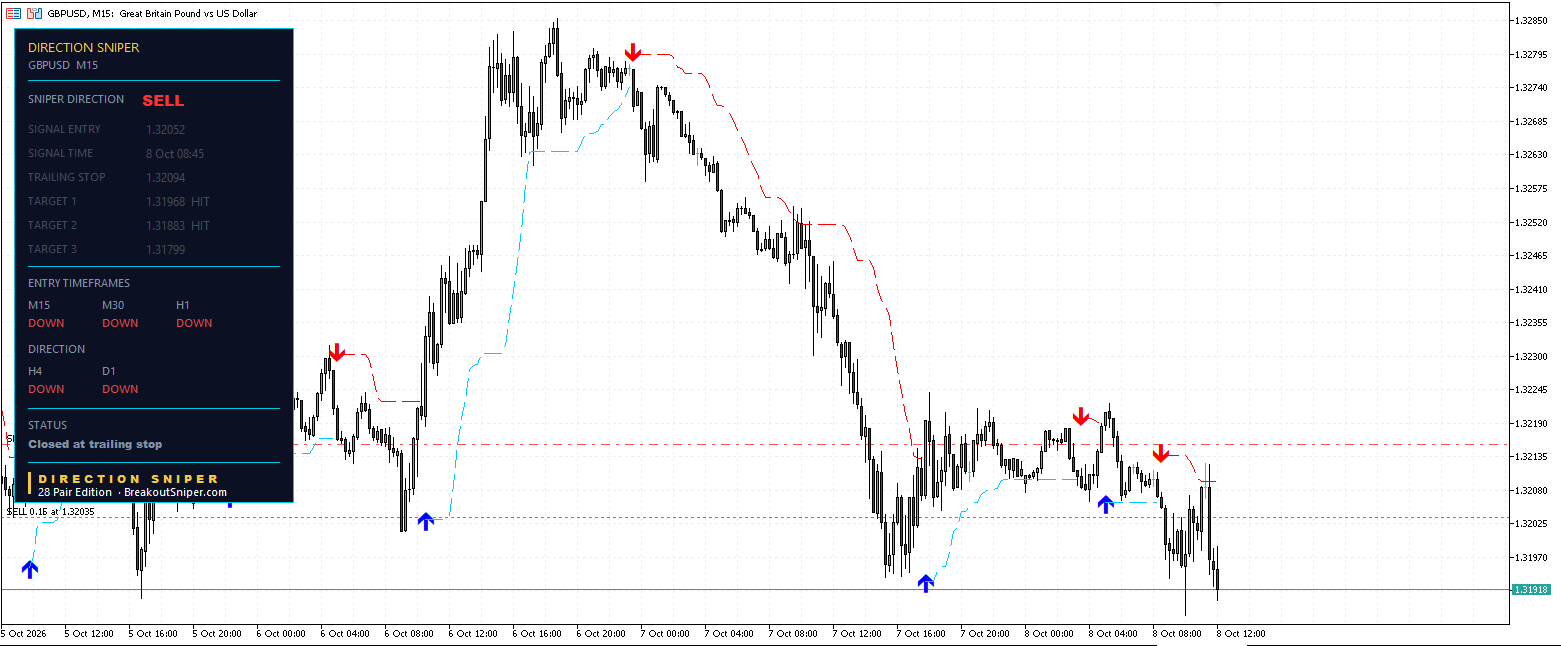
Here is the mechanism, in two numbers.
M15 trailing stop: 1.32094.
M30 trailing stop: 1.32155.
Six point one pips between them.
Price rallied back up into that gap. It reached far enough to take out the fifteen minute and not far enough to touch the thirty minute. Then it turned and fell away again to where it is now.
One chart was closed by a move that the chart next to it never even registered.
That is what stop distance actually is. It is not caution, and it is not a setting you choose based on how confident you feel. It is a measurement of how much noise a particular chart has to tolerate before the idea on that chart is wrong. Eight pips of structure on the fifteen minute. Twelve on the thirty minute. The difference is six pips, and this morning six pips was the whole story.
What the tool does for you here: both numbers were on the screen before either trade needed managing. You never choose a stop distance on a morning like this, you read it, and the number comes from the chart rather than from how the trade feels.
3. And The Tighter One Was Not The Loser
This is where the obvious conclusion is wrong, so it is worth slowing down.
The natural read is that the tight stop failed and the wider stop was correct. Look again.
The M15 reached two of its three targets. 1.31968 and 1.31883, both reached, before it closed at 1.32094.
The M30 has reached one. 1.31947. Its second target at 1.31825 is still 9.3 pips below where price is now.
So the chart with the tighter stop got further, faster, and then it was taken out. The chart with the wider stop got less far and is still in the trade with two targets left.
Neither one of those is the better trade. They are doing different jobs.
A tight stop buys you size and speed. More position for the same money, targets reached sooner, and a level close enough to price that ordinary movement can reach it.
A wider stop buys you time. Less position for the same money, slower to its targets, and enough room that the same movement leaves it alone.
The trader who ran both got the fast targets on one and is still holding the slow one. The trader who ran only the fifteen minute is flat. The trader who ran only the thirty minute has banked less so far.
What the tool does for you here: every timeframe builds its own ticket with its own stop and its own targets, at the same time, on the same chart. You are not choosing which one is right in advance, which is the choice nobody can actually make. You are seeing all of them.
4. The Four Hour Is Barely Out Of Bed
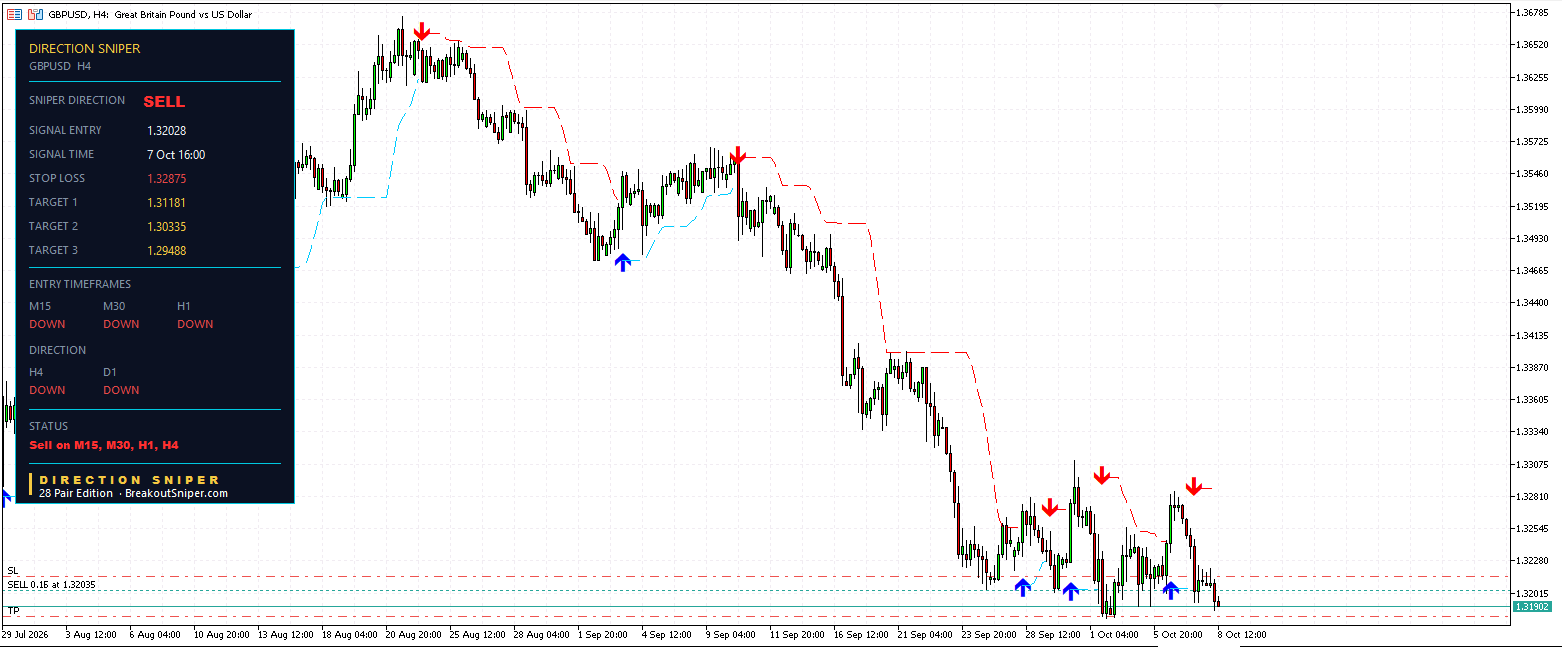
While those two were being decided in a fifteen minute window, the four hour ticket is doing almost nothing.
Sell at 1.32028 from 7 Oct 16:00. Stop loss at 1.32875, which is 84.7 pips. Targets at 1.31181, 1.30335 and 1.29488.
Price is 11.0 pips ahead of that entry, which is thirteen percent of the way to its first target. Its level still reads STOP LOSS rather than TRAILING STOP, so nothing has trailed and the full 84.7 pips is what is being carried.
Meanwhile the one hour, which entered at 1.32625 at 04:00 yesterday with 20.2 pips of risk, has already reached all three of its targets.
Two tickets in the same market, one of them finished and one of them thirteen percent of the way into its first move. They are not in competition. They are running on different clocks, and the four hour is measuring a move that the one hour was never trying to catch.
5. Compare This With Gold This Morning
This is the part you only see if you have the panel on more than one market.
Gold today has the daily and the four hour pointing down and two of its three entry charts pointing up. One live ticket out of three, and the other two waiting for alignment.
GBP USD today has every single timeframe pointing down. Four tickets, nothing waiting.
Same morning. Same account. Same tool. Two completely different pictures.
A trader with gold on the screen this morning saw a market that was mostly on hold. A trader with GBP USD saw a market where every chart agreed. Neither of them was more right than the other, they were just looking at different markets, and the only way to know which kind of morning you are having is to be able to see both.
Today’s gold post is the other half of this comparison.
What the tool does for you here: the reason to run the panel across many pairs is not more signals. It is that on any given morning some markets have everything aligned and some have almost nothing, and you cannot tell which is which by looking at one chart.
6. What The Lot Size Looks Like Across The Four
The stop distance is where the position size comes from, so four different stops means four different sizes for exactly the same money.
On a ten thousand dollar account risking half a percent, which is fifty dollars, at ten dollars per pip per standard lot:
| Chart | Risk | Lot size | Money at risk |
|---|---|---|---|
| M15 | 8.4 pips | 0.59 | $49.56 |
| M30 | 12.3 pips | 0.40 | $49.20 |
| H1 | 20.2 pips | 0.24 | $48.48 |
| H4 | 84.7 pips | 0.05 | $42.35 |
The fifteen minute ticket allows almost twelve times the position of the four hour for the same fifty dollars at risk.
That is not a reason to prefer it. It is the reason the two of them feel like completely different trades even though they are the same idea on the same pair. More size, closer stop, faster outcome on one. Less size, distant stop, slow outcome on the other.
The stop distance decides the lot size, and the lot size decides how a loss feels. Every time.
Where The Levels Sit Now
With GBP USD at 1.31918:
M30 Target 2 at 1.31825 is 9.3 pips below, the nearest live level on the board, with Target 3 at 1.31702 a further 12.3 below that.
H4 Target 1 at 1.31181 is 73.7 pips below. That is a four hour position working on four hour speed, which is what it is for.
Above price, the M30 trailing stop at 1.32155 is the first level and the only live risk on the shorter charts, since the M15 is closed. Further up, the H4 stop at 1.32875 is 95.7 pips away.
Already behind price, the H1 third target at 1.32020 and the M15 second target at 1.31883 have both been reached.
Those are the levels on the chart and how far price sits from each. None of it is a forecast.
What You Are Actually Buying
Every timeframe at once, with its own stop. The whole of this post exists because four tickets were on the screen together. One of them would have told you almost nothing.
A stop measured from the chart rather than chosen by feel. Eight pips on one timeframe and eighty four on another, in the same market, on the same morning. Six pips of difference decided which of two near identical trades survived this morning.
A trailing stop level recalculated as structure tightens, labelled so you can see which one you are carrying. The four hour still reads STOP LOSS, the thirty minute reads TRAILING STOP. You move the order on your platform yourself. The indicator does the arithmetic, the click is yours.
And the same panel across every market you trade, because gold and the pound looked nothing like each other this morning and there was no way to know that from one chart.
Direction Sniper prints all of it on your charts in MetaTrader and keeps it live.
- 28 Pair Edition, $77, every major, minor and cross, which is the edition these four panels came from and the only way to see the comparison in section five
- Forex Majors Edition, $47, the seven majors including GBP USD
- Gold and Silver Edition, the original and still the one most of our traders run
- EURUSD Edition, $7, the cheapest way to put the panel on a chart and watch it work for yourself
One question. When a trade of yours gets stopped out, do you know how far away the stop on the next chart up was? Tell us on the reviews and feedback page.
Trading foreign exchange, gold and other leveraged products carries a high level of risk and is not suitable for everyone. The levels above describe where the indicator placed entries, stops and targets at the time the charts were read, and the status shown for each ticket is the status the panel displayed at that moment. The position marked on the charts is one of our own and is shown for transparency rather than as a recommendation or a model portfolio. Price reaching a published target level is not the same as a realised result, which depends on position size, spread, slippage and how each trader manages an order. The four hour, one hour and thirty minute positions were still open, so their outcomes are not known. A stop is a level rather than a guarantee, and gaps or fast markets can fill you past it. Lot sizing figures are arithmetic for illustration and are not a recommendation about how much anyone should trade. Nothing here is financial advice. Past performance does not guarantee future results.

