Gold Forecast Today, 5 October 2026: How Do You Know When a Trade Is in Trouble?
Executive Summary
Gold is in SELL mode. Daily down, four hour down, thirty minute and one hour down. The fifteen minute is the only chart pointing up, and it has no ticket at all.
Three live sell tickets. One is comfortable, one is almost finished, and one has quietly made itself nearly free.
Gold is trading at 4155.48.
| Chart | Entry | Risk | Where it stands | Risk used |
|---|---|---|---|---|
| H4 | 4131.38 | 80.79 | 24.1 behind | 30% |
| M30 | 4126.44 | 37.28 | 29.0 behind | 78% |
| H1 | 4159.00 | 49.36 | 3.5 ahead | stop at break even |
| M15 | No ticket | Still rising |
Everything useful on this page comes from one thing. Every ticket arrived with its stop already placed. Without that, none of what follows is possible to work out.
1. Direction Is Decided Before You Look At Anything Else
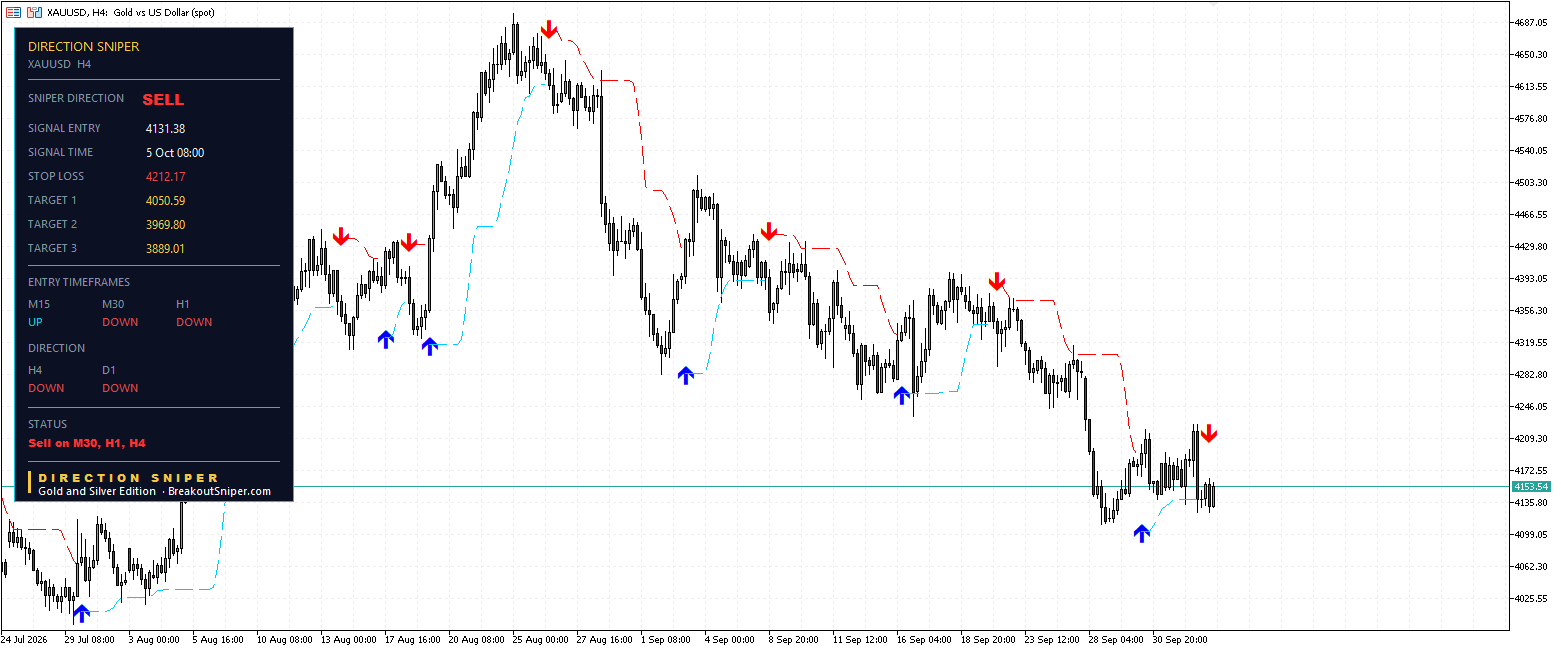
The daily and the four hour are the gatekeepers. They do not find entries. They decide which direction is allowed, and today both read DOWN.
That makes the verdict SELL for gold, full stop. No shorter chart gets to argue with it. The status line on all four panels says the same thing: Sell on M30, H1, H4.
Most of the money lost in gold is lost by people who never settled this question before they started looking for entries. They find a setup first, then look for a reason, and the reason is usually the chart that happens to agree with the setup.
What the tool does for you here: it answers the direction question once, from the two charts that should answer it, and then holds that answer across every other chart you open. You are never choosing which timeframe to believe, because that was decided before you sat down.
2. The Bounce That Produced Nothing
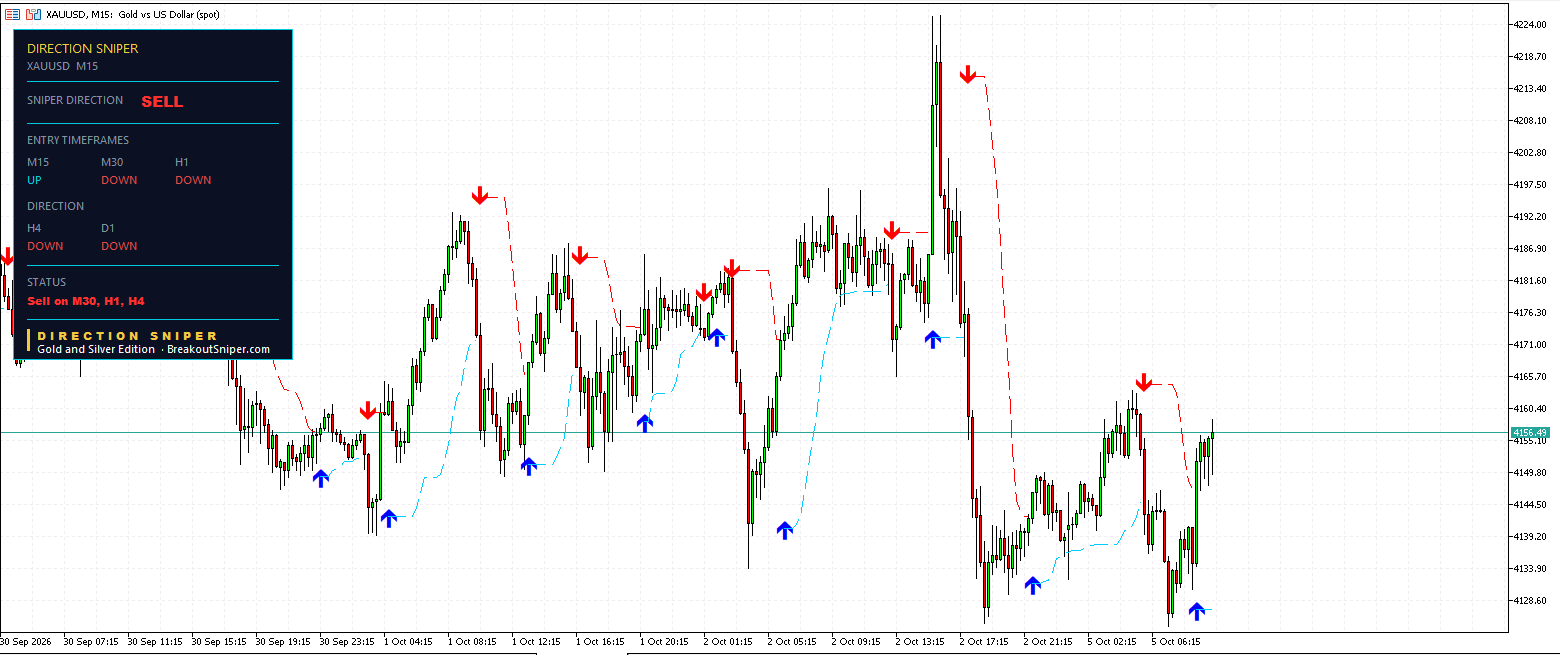
The fifteen minute chart is rising. Green candles, price lifting, and on that chart alone it looks like a floor forming.
The panel gives it no entry, no stop and no targets. Nothing at all. It will not build a sell ticket on a chart still pointing the other way, so it stands aside and waits.
This is where most of the damage happens to short term traders. They see strength on a small chart in a market that is falling everywhere above it, and they take it. Sometimes a bounce like this is the start of a real reversal. Most of the time it is a rally inside a downtrend that has not broken anything, and it ends where it started.
Nobody can tell which in advance. That is the honest part.
What the tool does for you here: it will not hand you a ticket into a bounce, and it will not pretend the bounce is a sell signal either. It simply refuses to act until that chart has turned back down, which removes the single most expensive decision you make on a day like this. AUD USD is showing the identical shape this morning, which usually means the dollar is driving both rather than anything specific to gold.
3. How To Tell If A Trade Is Actually In Trouble
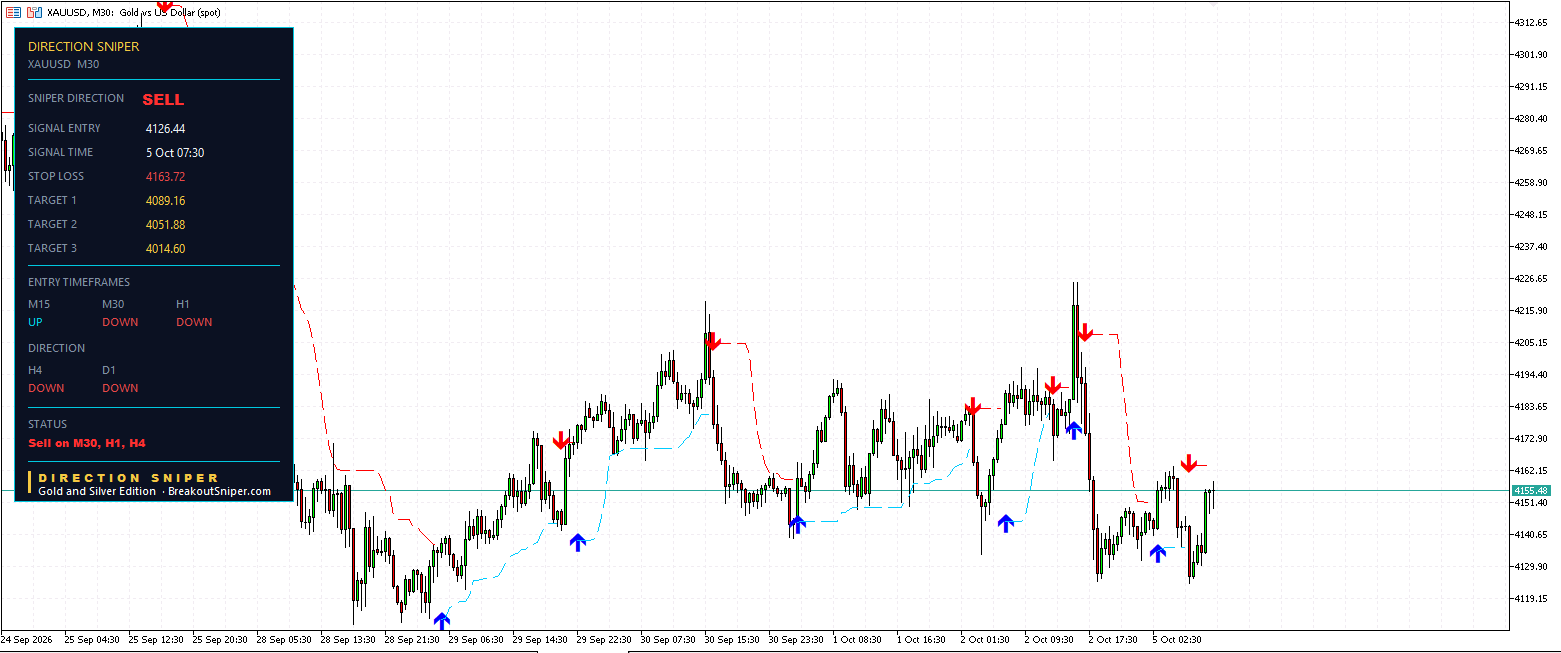
Here are two of this morning’s tickets.
The H4 entered at 4131.38 with its stop at 4212.17. Price is now 24 points against it.
The M30 entered at 4126.44 with its stop at 4163.72. Price is now 29 points against it.
Five points between them. They look like the same amount of trouble.
They are nothing like it.
| Risk | Points against | Risk spent | Stop is | |
|---|---|---|---|---|
| H4 | 80.79 | 24.1 | 30% | 56.69 away |
| M30 | 37.28 | 29.0 | 78% | 8.24 away |
The H4 has barely started. The M30 is almost over.
So here is the measure that matters, and it is one division.
Distance from your entry to the current price, divided by the distance from your entry to your stop.
Twenty points against an eighty point stop is noise. Gold does that twice an hour. Twenty points against a twenty five point stop is nearly the end. Same twenty points, completely different situation, and almost nobody does the division.
What the tool does for you here: the division is only possible because the stop was handed to you at entry as a precise number. If you placed your stop by eye, or moved it after the fact, you have nothing to divide by and you are left judging a trade by how it feels. Every ticket here arrives with its stop already fixed, which is what turns a vague worry into a percentage.
4. The Stop That Shrank From 49 Points To One
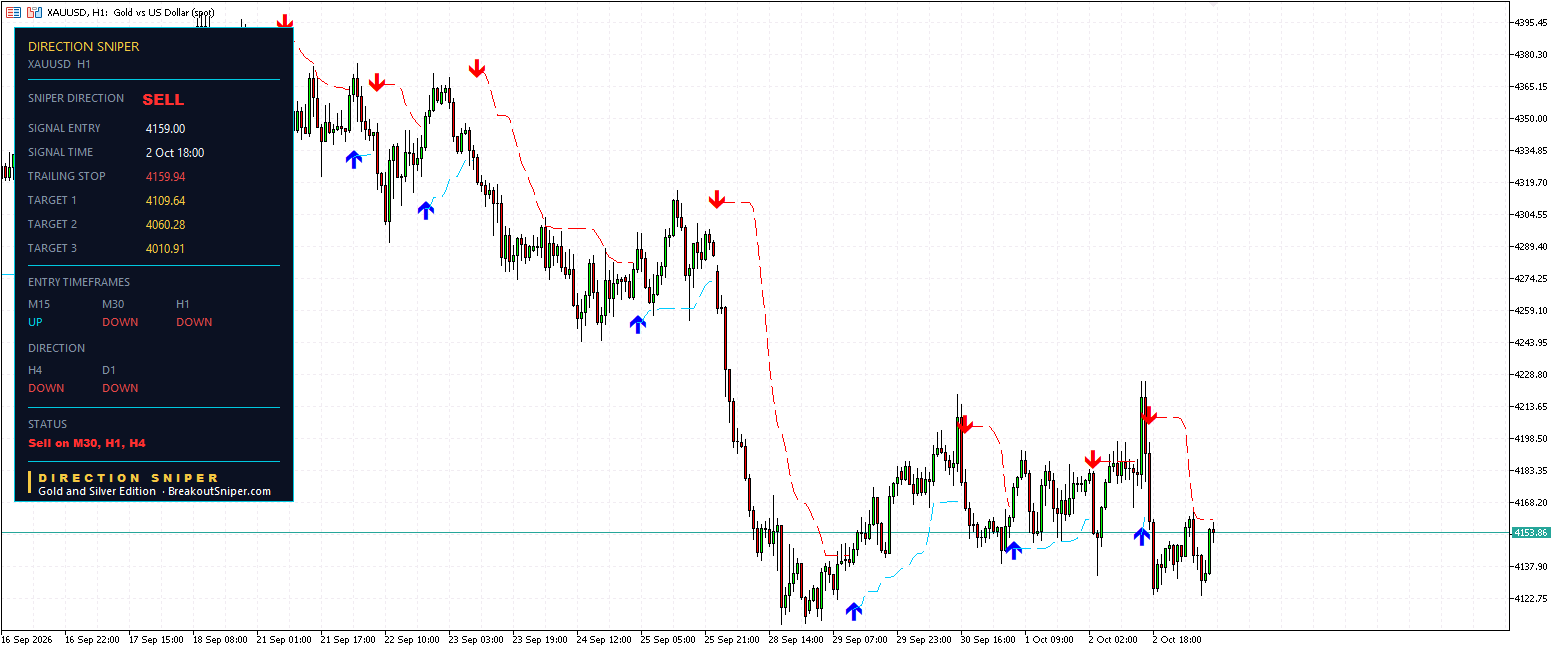
The third ticket is the quiet one, and it is the best thing on the page.
It entered at 4159.00 on 2 October at 18:00, three days ago. It has not reached a single target. By any normal measure it has done nothing at all.
But look at its stop.
| Stop level | If the stop is hit | |
|---|---|---|
| At entry, 2 October | 4208.36 | Loses 49.36 points |
| Today, 5 October | 4159.94 | Loses 0.94 points |
Same entry price. Same open position. Nothing has gone right.
And the most it can still cost has fallen from 49.36 points to 0.94. At 0.01 lots on gold, that is a trade that was risking $49 now risking 94 cents.
Why it only moves one way. On a sell, the trailing stop goes down and never back up. It follows price, locks in ground that has been covered, and never widens out again. So from the moment you enter, the worst case can only get smaller.
That is worth sitting with, because it is the opposite of how a stale trade feels. A position going nowhere feels like it gets more dangerous the longer it sits there. Mechanically the reverse is true.
And the label tells you which stage a trade is at. The M30 and the H4 both still read STOP LOSS, so they are carrying their full original risk. The H1 reads TRAILING STOP, so its risk has already been cut. One glance tells you which of your positions have given ground back and which have not.
What the tool does for you here: it moves the stop for you, automatically, on every open position, and it changes the label so you can see it has happened. Most traders either forget to trail, trail too early and get shaken out, or trail by feel on whichever chart they happen to be looking at. Here it runs whether you are watching or not, and the only direction it can go is in your favour.
Trailing stops get talked about as a way to protect profit on a big winner. That is the smaller half of the job. The bigger half is what you are looking at here: taking the trades that go sideways and never reach a target, which is most trades anyone takes, and quietly reducing what they can cost. You do not have to be right. You only have to still be in.
5. But The Real Protection Is The Lot Size
Everything above tells you where you stand. None of it tells you whether you are safe. Only one number does that, and you typed it in before the trade existed.
Gold is where this bites hardest, because the contract is large. One standard lot is one hundred ounces, so every one dollar move is one hundred dollars. Today’s three stops are worth $3,728, $4,936 and $8,079 per standard lot.
So the size comes from the stop:
Lot size = risk in money divided by (stop distance x 100)
On a ten thousand dollar account risking half a percent, which is fifty dollars:
| Chart | Stop | 0.01 lots risks | Percent of account |
|---|---|---|---|
| M30 | 37.28 | $37.28 | 0.37% |
| H1 | 49.36 | $49.36 | 0.49% |
| H4 | 80.79 | $80.79 | 0.81% |
All three come out at 0.01 lots, because that is the smallest most brokers allow. On gold you do not fine tune the size. You choose which timeframe you can afford.
On a one thousand dollar account, the minimum position on that M30 ticket risks $37.28, which is 3.7 percent of the whole account on a single trade. None of these fit. That is the arithmetic telling you gold at these stop distances does not belong on a thousand dollar account yet, however much you want to trade it.
Now put that against the M30 sitting 78 percent of the way to its stop
Somebody is watching that position right now.
Sized from the stop at 0.01 lots, they are about to lose $37. That is 0.37 percent. Annoying. Forgotten by Thursday.
Sized at 0.10 lots because gold felt like a big opportunity this morning, they are about to lose $372. That is 3.7 percent, and it is the size of loss that makes people move their stop, double down, or close everything and walk away from the screen.
Same market. Same entry. Same stop. Same outcome.
The only difference is the number typed into the box before any of it started.
What the tool does for you here: it gives you the exact stop distance on every ticket, on every timeframe, the moment the trade appears. That one number is the input the whole calculation depends on. Without it you are guessing, and a guessed lot size is the single most expensive habit in retail trading.
If you are watching a position right now with your stomach tight, the size was too big, and that was settled before you clicked.
Where Things Go From Here
The M30 resolves first. It needs price below 4126.44 to work and it is stopped at 4163.72. Eight points one way, twenty nine the other. It happens today.
The H1 is already nearly free, with its stop a point above its entry. Its first target at 4109.64 is 46 points below here.
The H4 has room. Thirty percent into its risk, 56.69 points of stop remaining, first target at 4050.59. On a four hour chart that is a normal amount of nothing happening.
The M15 is where a fourth ticket comes from. The verdict is already SELL, so the permission is in place. Only that chart has to turn back down.
Those are the levels already on the chart and how far price sits from each. None of it is a forecast.
What You Are Actually Buying
Three things, and today’s charts showed all three.
Direction, settled once. The daily and the four hour answer it, and no smaller chart gets to overrule them. You stop choosing which timeframe to believe.
No ticket into a bounce. When a chart is still rising against the verdict, you get nothing on it, and nothing is the correct answer. The fifteen minute this morning is the whole demonstration.
A stop that is placed for you and then tightens on its own. Precise at entry, so you can size the position properly. Automatic afterwards, so your worst case only ever shrinks.
Direction Sniper prints all of it on your charts in MetaTrader and keeps it live.
Gold and Silver Edition is the edition these four screenshots came from, and the one most of our traders run. XAUUSD and XAGUSD both covered.
Trade forex as well?
- Forex Majors Edition, $47, the seven majors
- 28 Pair Edition, $77, every major, minor and cross
- EURUSD Edition, $7, the cheapest way to see the panel on a chart
Two more from today. The GBP USD post covers sizing a position and splitting it across three targets. The AUD USD post covers the same fifteen minute disagreement you are seeing on gold here.
One question. Do you work out what fraction of your stop a trade has used, or do you just look at the money? Tell me on the reviews and feedback page.
Gold Today: Common Questions
Is gold a buy or a sell today?
On 5 October 2026 the Direction Sniper panel reads SELL on gold. The daily and the four hour both point down, which sets the verdict, and the thirty minute and one hour point down as well. The fifteen minute is the only chart pointing up and it has no ticket. This describes what the indicator displays and is not a recommendation to trade.
What are the gold key levels today?
With gold at 4155.48, the M30 stop at 4163.72 is just above and the H1 stop at 4159.94 sits a point higher than its own entry. Above those, the H4 stop is far out at 4212.17. Below, the first targets are the M30 at 4089.16, the H1 at 4109.64 and the H4 at 4050.59.
How do you know when a trade is in trouble?
Not by the points, but by the fraction of your own stop you have spent. Divide the distance from your entry to the current price by the distance from your entry to your stop. Today the gold H4 is 24 points behind on an 80.79 point stop, which is 30 percent, while the M30 is 29 points behind on a 37.28 point stop, which is 78 percent. Similar point distances, completely different situations.
What lot size should I use on gold?
One standard lot of gold is one hundred ounces, so every one dollar move is one hundred dollars. Divide your risk in money by the stop distance multiplied by one hundred. On a ten thousand dollar account risking half a percent, today’s three stops of 37.28, 49.36 and 80.79 points all come out at 0.01 lots, risking $37, $49 and $81. On gold you usually choose which timeframe you can afford rather than fine tuning the size.
Why is there no signal on the gold 15 minute chart today?
Because that chart is still rising while the verdict is to sell. The panel will not build a sell ticket on a timeframe currently pointing the other way, so it issues no entry, no stop and no targets and waits for alignment. AUD USD is showing the same shape this morning, which is usually a sign the dollar is driving both rather than anything specific to gold.
Why has the gold one hour stop moved to break even?
That ticket entered at 4159.00 on 2 October with its stop at 4208.36, which is 49.36 points of risk. Three days later the trailing stop has walked down to 4159.94. Hit at entry it would have cost 49.36 points. Hit now it costs 0.94. The trade has not reached a single target, and the level the indicator is showing has cut the worst case by 98 percent. On a sell the trailing stop only moves down, never back up. You do have to move the order on your platform to match it, otherwise you are still carrying the original stop.
Does Direction Sniper move your stop loss automatically?
No. It calculates the trailing stop and shows you where the level should now sit, updating it as price moves and changing its label from STOP LOSS to TRAILING STOP once trailing has started. Moving the order on your platform is still your job. What it removes is the arithmetic and the judgement, not the click, and a level you can see but have not acted on is still your original risk.
Trading gold, silver, foreign exchange and other leveraged products carries a high level of risk and is not suitable for everyone. The levels above describe where the indicator placed entries, stops and targets at the time the charts were read, and the positions described were still open. Lot sizing figures are arithmetic for illustration and are not a recommendation about how much anyone should trade. Check your own broker’s contract specifications. Nothing here is financial advice. Past performance does not guarantee future results.

