Gold Price Forecast Today, 29 September 2026: The H4 Ticket Is Complete and the H1 Trail Has Caught Up
Here is the gold price forecast today, 29 September 2026.
Gold is at 4130.24. It closed last week around 4306. The two slowest timeframes on the panel did almost all of the work in that move, and they did it without a single decision from me.
The H4 ticket has reached all three targets. The H1 ticket has banked two of three and is still running, with its trailing stop now sitting 117 points below its own entry price.
Gold Price Forecast Today: The Verdict Is Still SELL
- Sniper Direction: SELL
- Direction: H4 DOWN, D1 DOWN
- Entry timeframes: M15 UP, M30 UP, H1 DOWN
- Status: Sell on H1, H4
Both gatekeepers still point down, so the sell is still authorised. H1 still agrees with them. M15 and M30 have both turned up during the pause at the lows, so neither is issuing anything.
H4: All Three Targets Reached
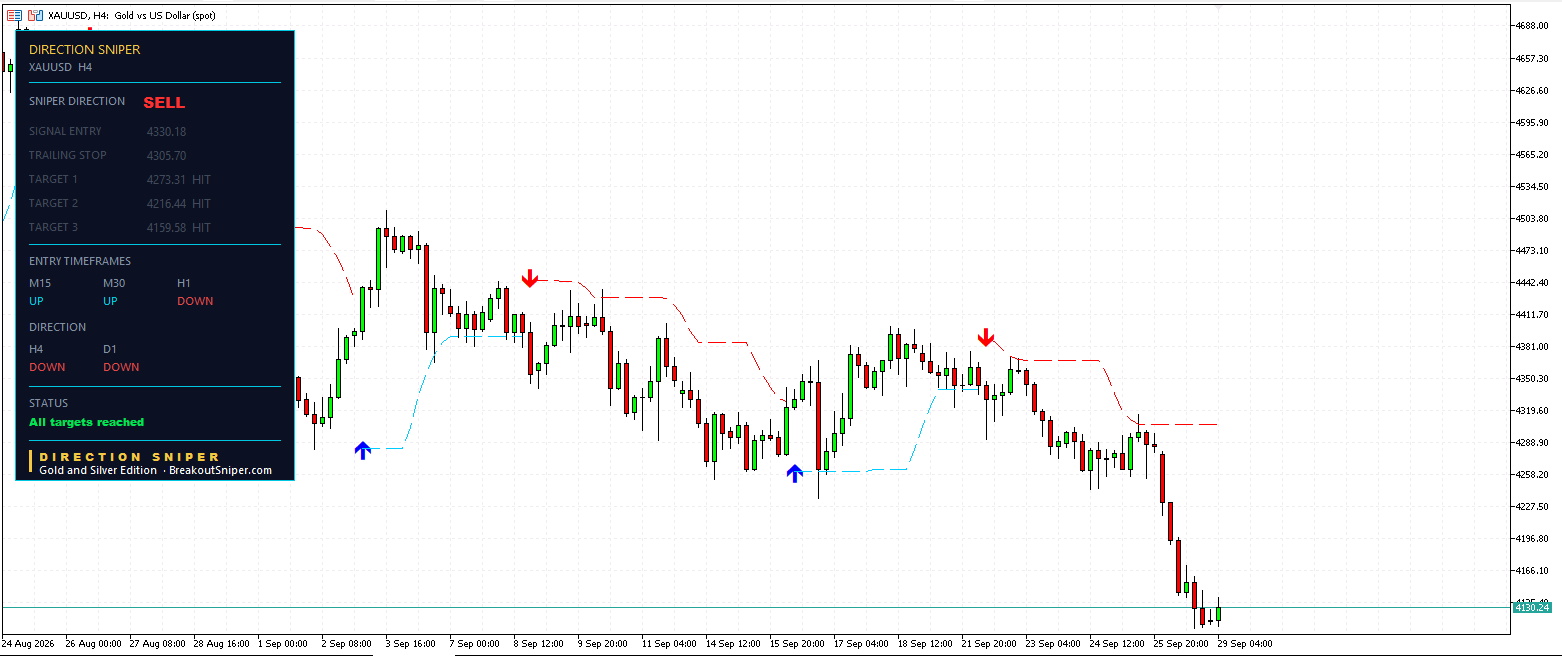
- Signal Entry: 4330.18 (sell)
- Trailing Stop: 4305.70
- Target 1: 4273.31 HIT
- Target 2: 4216.44 HIT
- Target 3: 4159.58 HIT
- Status: All targets reached
The risk on this ticket was 56.87, entry to stop. The three targets sat at one, two and three times that distance below the entry: 4273.31, 4216.44 and 4159.58.
Gold went through all three and kept going. It is now at 4130.24, below every level this ticket was ever asked to reach. The panel greys the whole thing out and prints All targets reached in green, because there is nothing left for it to do.
One ticket. Three targets. 170.60 points from entry to the final target, and the only number I had to know was the one printed on the chart when it fired.
H1: Two Targets Banked, and the Trail Has Caught Up
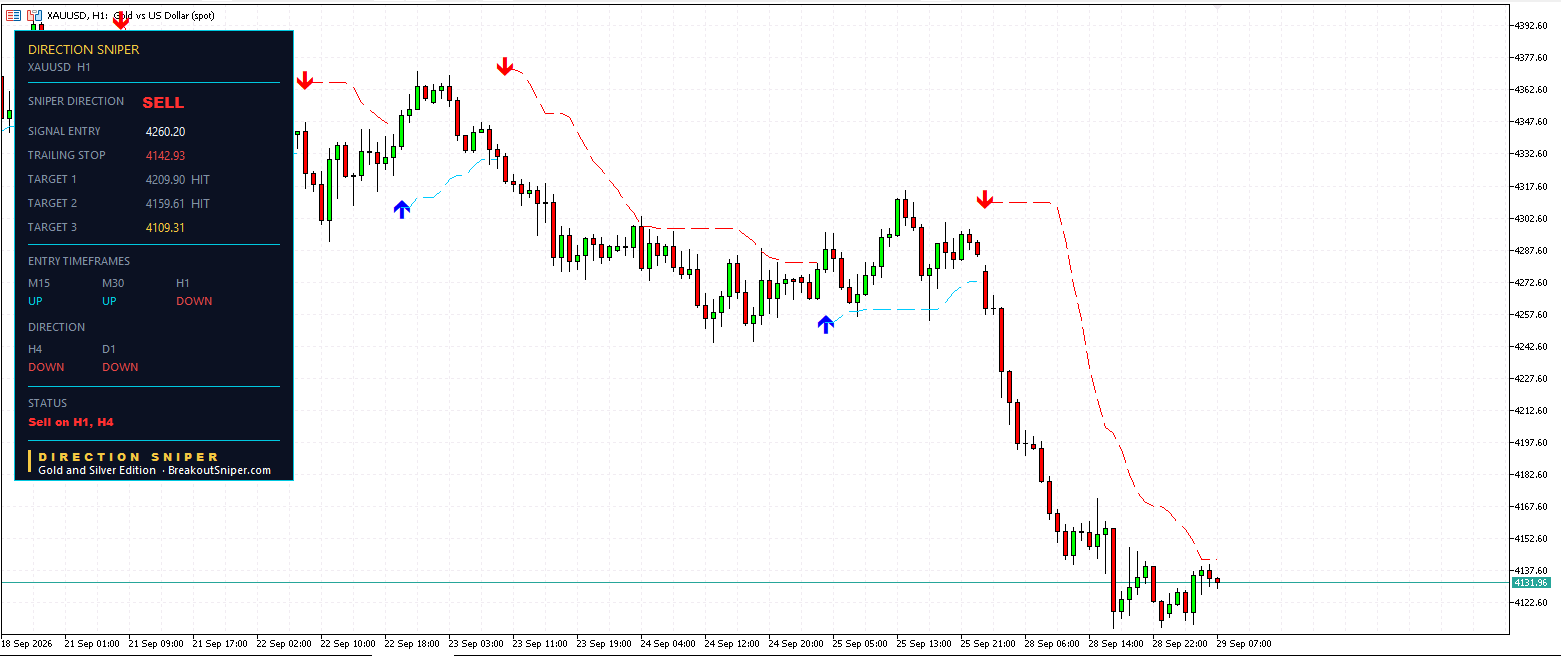
- Signal Entry: 4260.20 (sell)
- Trailing Stop: 4142.93
- Target 1: 4209.90 HIT
- Target 2: 4159.61 HIT
- Target 3: 4109.31
This is the same H1 ticket I published yesterday, and there is one number on it worth looking at closely.
Yesterday the trailing stop on this ticket read 4291.16, which was above the 4260.20 entry even though two targets were already marked HIT. I wrote at the time that this was not a fault, that a one hour trailing level moves in bigger steps and lags after a fast drop, and that it would catch up.
Today it reads 4142.93. That is 117.27 below the entry, and 148.23 lower than where it stood twenty four hours ago.
It caught up.
I am pointing this out because it is the part of a trailing system nobody explains properly. The level does not move smoothly and it does not move at the same speed on every chart. It ratchets, in steps, in the trade’s favour only, and on a slower timeframe it will sometimes sit a long way behind price before it snaps forward. If you did not know that, you would have overridden it yesterday and taken the trade off by hand.
The ticket is still open. Target 3 at 4109.31 is about 22 points below the current price and has not been reached.
Why the Slower Timeframes Won This Move
Here is the comment worth making about how this strategy actually behaves, because this week has been an unusually clean demonstration of it.
Gold fell roughly 200 points from Friday’s close. Four tickets existed across four timeframes. The two slowest ones, H4 and H1, captured the most of it, and the H4 caught the whole thing from 4330 down to 4159.
That is not luck and it is not a coincidence. A slower timeframe sets a wider stop, which means wider targets, which means it stays in a trending move that a fifteen minute chart takes a small bite out of and then exits. The tradeoff is real in both directions: the H4 risked 56.87 to do it, against the M15 risking 31.00, and on a day that went sideways the H4 would have given back more.
Bigger timeframe, bigger risk, bigger hold. That is the trade you are making when you choose which chart to take the ticket from, and the panel shows you all of them at once so the choice is visible rather than accidental.
M15 and M30: Both Up, Both Waiting
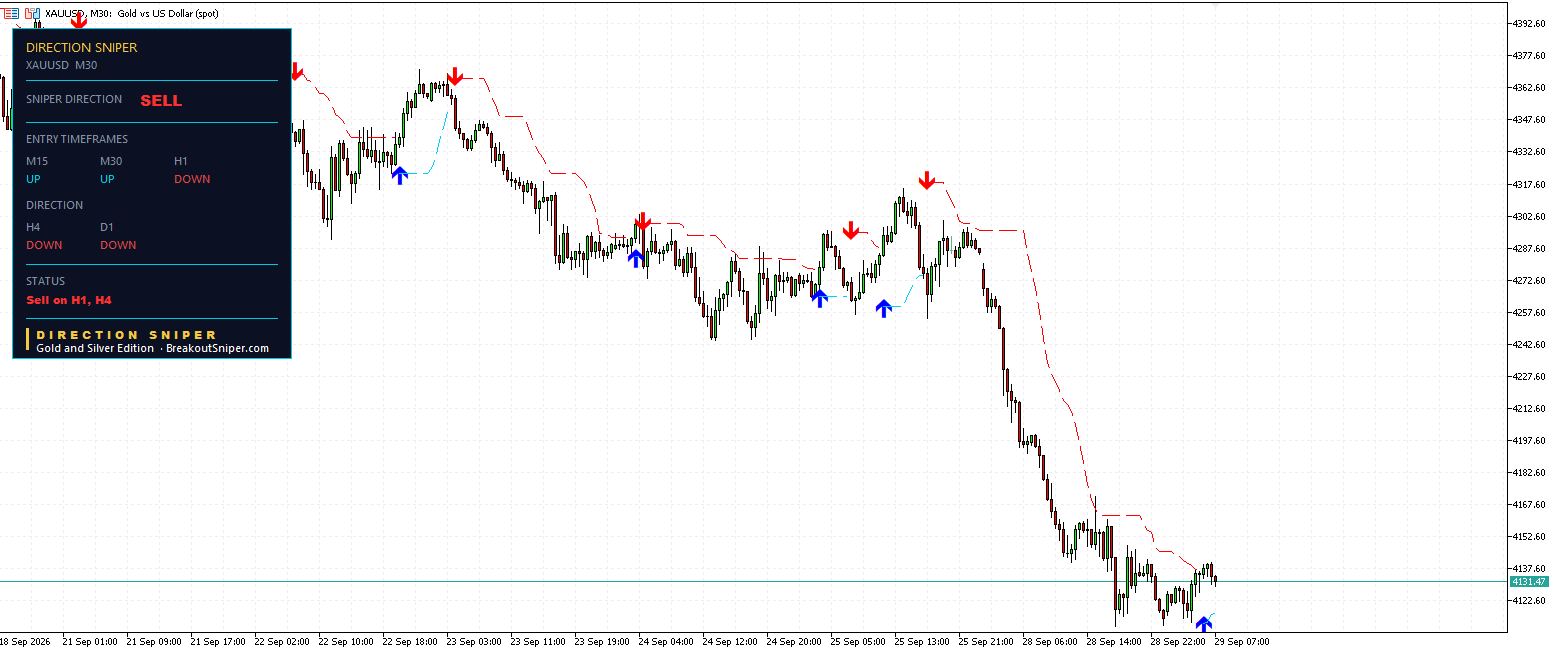
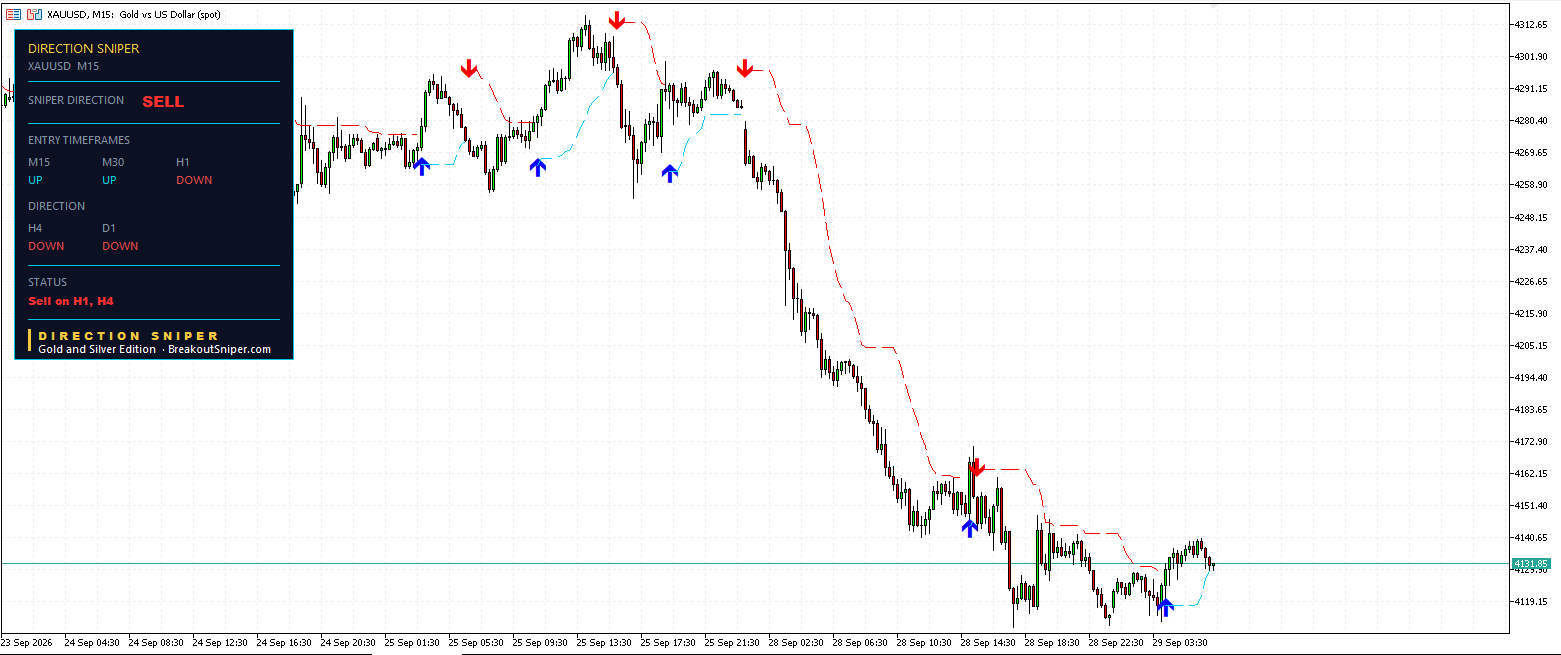
Neither of these charts carries a ticket, and the reason is on the row above the status line.
M15 is UP. M30 is UP. Both disagree with the SELL verdict, so neither gets a ticket, no matter how far gold has already fallen.
Gold stopped falling on Monday evening and has spent the hours since drifting sideways between roughly 4113 and 4140. That drift is enough to turn a fifteen minute and a thirty minute chart up. It is nowhere near enough to move H4 or the daily.
So the panel is doing two things at once and telling you both: hold what the slower charts gave you, and take nothing new on the faster ones.
Where the Next Signal Comes From
M15 and M30.
When a pause inside a downtrend runs out of energy, the timeframes roll back over from the smallest upward. M15 turns first, then M30. The moment either one flips back to DOWN while the direction is still SELL, a complete ticket appears on that chart with an entry, a trailing stop and three targets already calculated, and the alert fires.
Until that happens there is nothing new to take on gold. The H1 ticket keeps running with its own trailing level, the H4 ticket is finished, and the two fast charts are out of the conversation.
Three things that would change it. H4 or D1 turning up, which ends the SELL verdict entirely. M15 or M30 turning down, which produces the next ticket. Or nothing at all, the range continuing, which is the most likely single outcome of any given session and the one nobody plans for.
Gold Ticket Board, 29 September 2026
| Timeframe | Entry | Targets | Status |
|---|---|---|---|
| H4 | 4330.18 sell | 3 of 3 | Closed. All targets reached |
| H1 | 4260.20 sell | 2 of 3 | Running. Trail at 4142.93, Target 3 at 4109.31 |
| M30 | no ticket | — | M30 is UP. Waiting |
| M15 | no ticket | — | M15 is UP. Waiting |
One ticket finished, one still open, two timeframes with nothing to offer.
Every entry and every target on this board was printed on the chart before the move, and both tickets were published on this blog while they were still running. You can check yesterday’s post against the numbers above.
Get the Same Panel on Your Charts
Every number on this page came off one indicator on four charts. Two entries, two trailing levels, six target prices, and a plain statement that the two fast timeframes have nothing to offer right now.
No lines drawn. No stop distances worked out at midnight. No decision about whether a trailing level that looked wrong yesterday should be overridden by hand.
The Direction Sniper, Gold and Silver Edition reads H4 and D1 for you and prints one verdict: BUY, SELL or NO TRADE. It builds a complete ticket only when a timeframe genuinely agrees with that verdict, moves the protective level for you while the trade runs, marks each target as it is reached, and says Stand aside on the days the conditions are not there.
It does not make you right every time. Four days ago I published two gold tickets on this blog that were stopped out for a loss, with every number shown.
👉 Get the Direction Sniper, Gold and Silver Edition here
Two minute install on MT4 or MT5. Works on whatever broker you already use.
Read the Other Daily Sniper Reads
Or follow the reads as they happen on Telegram and Facebook.
Frequently Asked Questions
What is the gold price forecast today, 29 September 2026?
The Direction Sniper reads H4 and D1 as both DOWN, giving a SELL verdict. H1 agrees, M15 and M30 do not. The Status line reads Sell on H1, H4. Gold is trading at 4130.24.
Did the gold tickets reach their targets?
The H4 ticket entered at 4330.18 and reached all three targets at 4273.31, 4216.44 and 4159.58. The H1 ticket entered at 4260.20 and has reached Target 1 at 4209.90 and Target 2 at 4159.61, with Target 3 at 4109.31 still open.
Why is the H1 trailing stop below the entry price?
Because the trailing level only moves in the trade’s favour, and on a sell that means downward. It has walked from 4291.16 yesterday to 4142.93 today, which is 117.27 below the 4260.20 entry.
Why is there no gold signal on M15 or M30?
Both have turned UP during the pause at the lows, so neither agrees with the SELL verdict. No ticket is built on a timeframe that disagrees with the direction.
Where will the next gold signal come from?
M15 or M30. When a pause inside a downtrend ends, the timeframes turn back over from the smallest upward, so M15 is the early warning.

