
The gold and silver price forecast today: Direction Sniper shows gold in a downtrend on the 4 hour and daily, with an M15 sell ticket open. The M30 and H1 have both turned up on a bounce, so only the 15 minute is currently in line with the bigger direction. Readings as of 14 September 2026.
Gold Technical Analysis Today (XAUUSD)
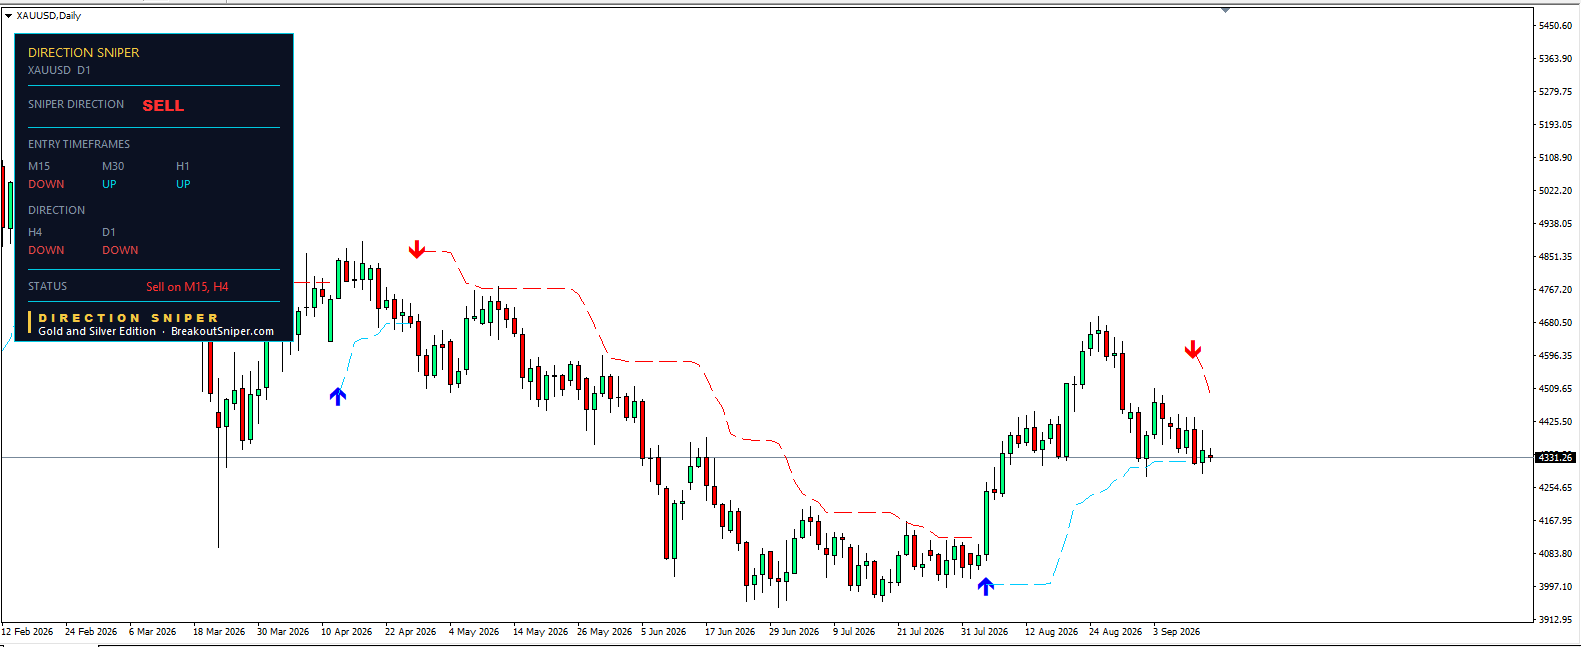
Direction Sniper shows gold in a downtrend, and today every timeframe agrees. The H4 and daily both read DOWN, and the M15, M30 and H1 all read DOWN as well. The status line shows “Sell on M15, M30, H1, H4,” the full set.
The daily chart shows how the tool behaves on a slow timeframe. The red dashed line has tracked price from above since the arrow in early September near 4,520. Earlier in the year the chart shows the same pattern in reverse: a blue arrow in March near 4,200, with the blue line running under price for weeks. On the daily, each step of that line is one trading day rather than 15 minutes, so it moves slowly and the direction it sets lasts much longer.
That is the point of reading the two together. The daily tells you which way the market is leaning. The entry timeframes tell you when. Today they are saying the same thing.
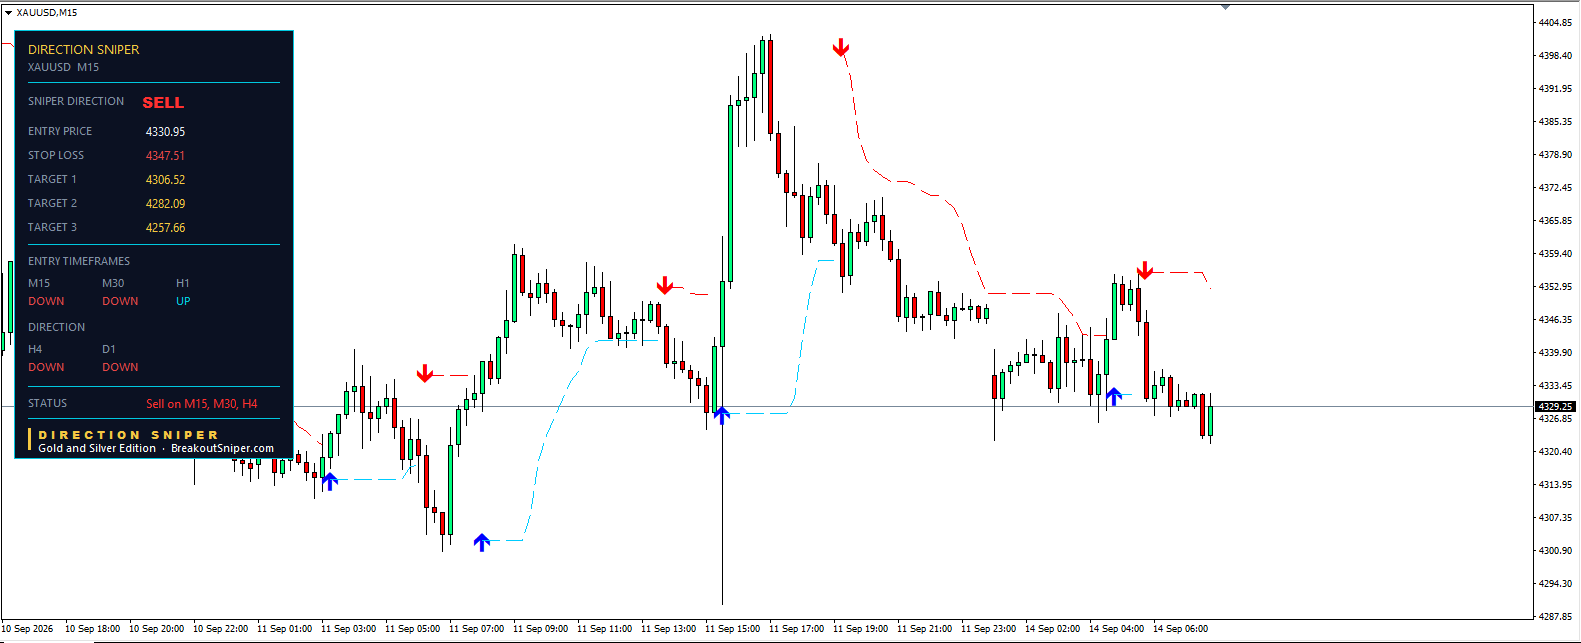
The Gold Trade Ticket on M15
Direction Sniper shows gold in a downtrend. The H4 and daily both read DOWN, and the verdict is SELL.
Among the entry timeframes, the M15 and M30 read DOWN while the H1 still reads UP after the bounce, so the status line shows “Sell on M15, M30, H4.”
Worth noting: the M30 is in transition right now. Checked a few minutes apart, the panel showed it UP and then DOWN. That is not a fault, it is what a timeframe on the edge of a turn looks like. The M30 candle has not closed yet, so its reading can still change. The H4 and daily, by contrast, have not moved at all.
The Gold Trade Ticket on M15
Direction Sniper printed a red sell arrow on the 15 minute chart near 4,353 on the 14 September 04:00 candle, as the bounce rolled over. With the M15 turning down in line with the H4 and daily, the panel generated a ticket automatically. Just before that, a blue arrow printed near 4,333 on the bounce itself, which is the move this ticket is now trading against.
This is what the panel displayed at the time of writing:
Entry price: 4,330.95
Stop loss: 4,347.51
Target 1: 4,306.52
Target 2: 4,282.09
Target 3: 4,257.66
The stop loss is not a fixed number. It is the red dashed line on the chart, and the indicator updates it every 15 minutes with each new M15 candle. As price falls, the line steps lower and follows price from above. You can see it working on the left of this chart, where the red line after the arrow near 4,398 on 11 September stepped down steadily as gold fell toward 4,346.
The ticket structure is the same every time. The stop sat about 16.6 above the entry, and the three targets step down in equal distances of about 24.4. Target 1 is further from the entry than the stop is, so the risk is defined before any trade is placed. Price is at 4,329.25, just below the entry.
Silver Price Forecast Today (XAGUSD)
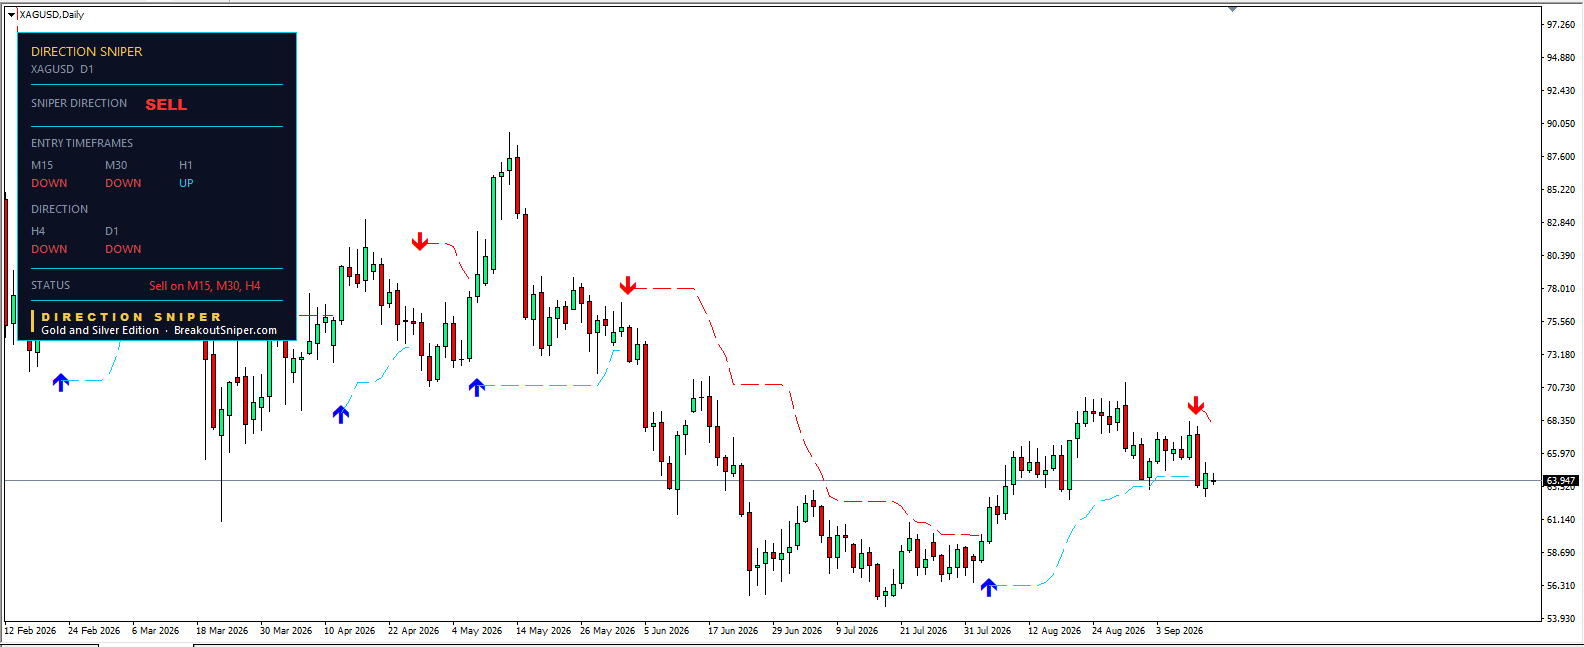
Direction Sniper shows silver in the same position as gold. The H4 and daily both read DOWN, the M15 and M30 read DOWN, and the H1 still reads UP after the bounce. The status line is identical: “Sell on M15, M30, H4.”
Price is at 63.947.
The daily chart puts today’s reading in context. The blue arrow in late March near 68 started a run that carried silver to about 90 by mid May. The red arrow in late May near 78 turned it down, and the red line tracked price through June and into July, down to about 54. The blue arrow at the end of July turned it back up to roughly 70 by late August. The newest red arrow, in early September near 68, flipped it down again, and that is the signal behind today’s direction.
Notice how few arrows there are on a full year of daily candles. Five turns in seven months. That is what a direction timeframe is meant to do: change rarely, and stay changed.
The Silver Trade Ticket on M30
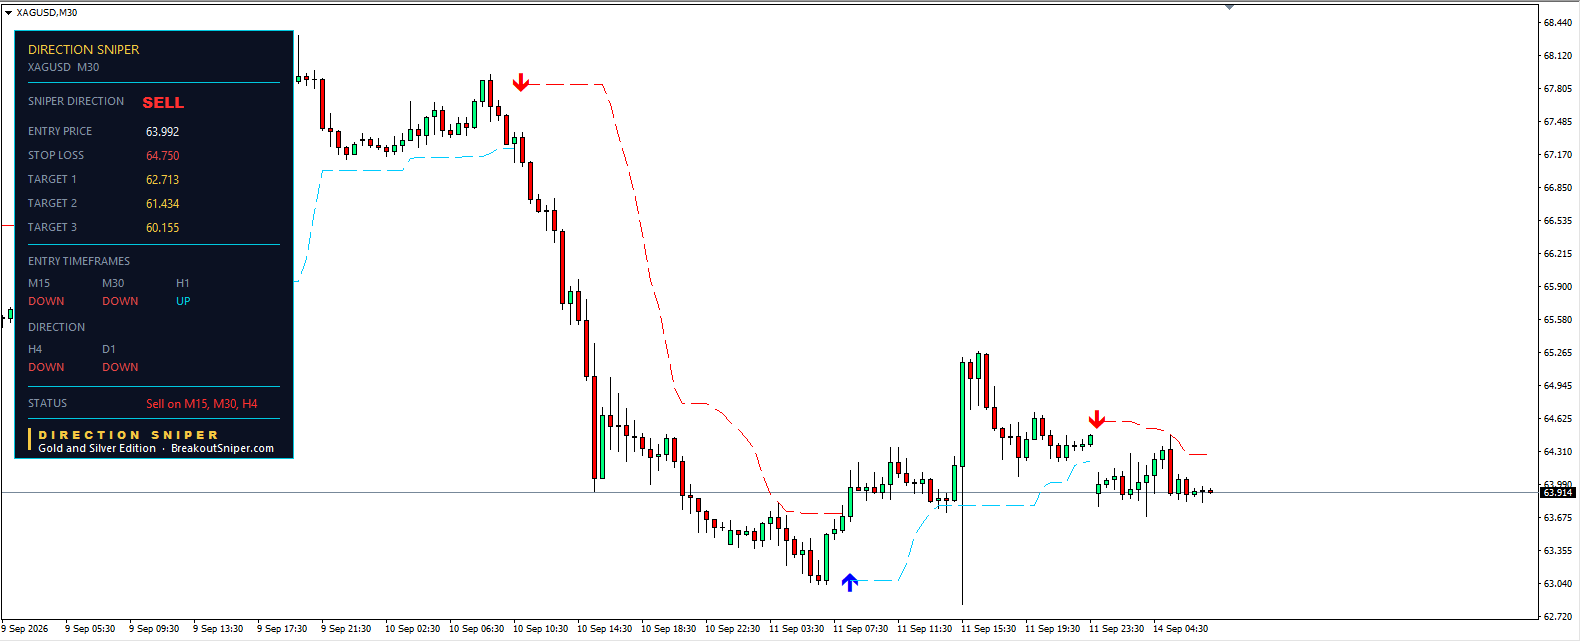
Silver’s ticket came from the 30 minute chart rather than the 15. Direction Sniper printed a red sell arrow near 64.60 on the 14 September candle, as the bounce off 63.00 rolled over and the M30 turned down in line with the H4 and daily.
This is what the panel displayed at the time of writing:
Entry price: 63.992
Stop loss: 64.750
Target 1: 62.713
Target 2: 61.434
Target 3: 60.155
Same structure as gold, scaled to silver. The stop sat about 0.76 above the entry, and the three targets step down in equal distances of about 1.28. Target 1 is further from the entry than the stop is. Price is at 63.914, just below the entry.
The stop is the red dashed line on this chart, and on the M30 it updates every 30 minutes rather than every 15. You can see it on the left of the chart: after the red arrow near 67.90 on 9 September, the line stepped down through the whole fall to 63.00. The steps are wider than on a 15 minute chart, because each one covers twice as much time.
That is the trade off between entry timeframes. The M15 reacts faster and gives a tighter stop. The M30 reacts slower, with a wider stop and more room, and fewer signals. Gold’s ticket today came from the M15, silver’s from the M30. The panel does not force you onto one timeframe, it shows you which ones have turned.
These levels are the indicator’s automatic output, shown to explain how the panel works. They are not a recommendation to buy or sell.
