GBP USD Forecast Today, 19 October 2026: How To Buy A Pullback Without Catching A Falling Knife
Knowing how to buy a pullback is one of the most valuable skills in trading, and one of the most misunderstood. Most traders buy the dip too early, while price is still falling, and end up catching a falling knife. The traders who do it well wait for three things: the trend, the pullback, and the moment the pullback ends.
Today’s GBP USD chart shows all three, live, on the Direction Sniper panel. Here is the method, then the real board.
How do you buy a pullback? Confirm the bigger trend is up on the 4 hour and daily charts, let price pull back until the faster charts turn down, then wait for a faster chart to turn back up before you buy. Place your stop where the pullback would become a reversal, and size the trade so that stop costs a small, fixed share of your account.
What Is A Pullback In Trading?
A pullback is a temporary move against the main trend. In an uptrend, price rises, dips for a while, then continues higher. The dip is the pullback.
Pullbacks are where good entries live. You get to buy an uptrend at a lower price, with a tighter stop, than you would have had chasing the high.
The problem is that every pullback starts out looking exactly like a reversal. On a fast chart, you cannot tell them apart in the moment. That is where most traders get hurt.
Pullback Or Reversal: How Do You Tell The Difference?
| Pullback | Reversal | |
|---|---|---|
| Fast charts (15 minute, 30 minute, 1 hour) | Turn down | Turn down |
| 4 hour chart | Stays up | Turns down |
| Daily chart | Stays up | Turns down, or stops agreeing |
| What it means | The trend is resting | The trend is changing |
| What you do | Wait for the fast charts to turn back up, then buy | Stand aside |
A pullback turns the fast charts. A reversal turns the big ones.
That is the whole difference. If only the fast charts have turned down, the uptrend is still in charge. If the 4 hour and daily turn as well, it is no longer a pullback, and buying it is buying against a new trend.
The hard part is checking five timeframes every time price moves. That is exactly what the Direction Sniper panel does for you.
How To Buy A Pullback In 3 Steps
Step 1. The trend: check the 4 hour and the daily. Both must point up. If they do, you only look for buys. If they disagree, there is no trend to buy, and the panel reads NO TRADE.
Step 2. The pullback: let the fast charts turn down. When the 15 minute, 30 minute and 1 hour turn down against an uptrend, the pullback is in progress. This is not the moment to buy. It is the moment to get ready.
Step 3. The trigger: wait for a fast chart to turn back up. The pullback ends when a fast chart lines back up with the bigger trend. That is your entry. On Direction Sniper, this is the moment a buy ticket prints, with the entry, the stop loss and three targets already calculated.
Most traders do step 2 and skip step 3. They buy while the pullback is still falling, because it looks cheap. Step 3 is what separates buying the end of the pullback from catching a falling knife.
When Should You Stay Out Of A Pullback?
There is one more rule, and it matters as much as the other three.
If the pullback goes deep enough to turn the 4 hour chart, it is no longer a pullback. Stand aside and wait.
On the Direction Sniper panel, the 4 hour trailing stop marks that line. If price reaches it, the 4 hour ticket closes. If the 4 hour then turns down against the daily, the verdict becomes NO TRADE, and the panel waits for the charts to agree again. No hoping, no averaging down, no guessing.
Today’s GBP USD Board: A Live Pullback
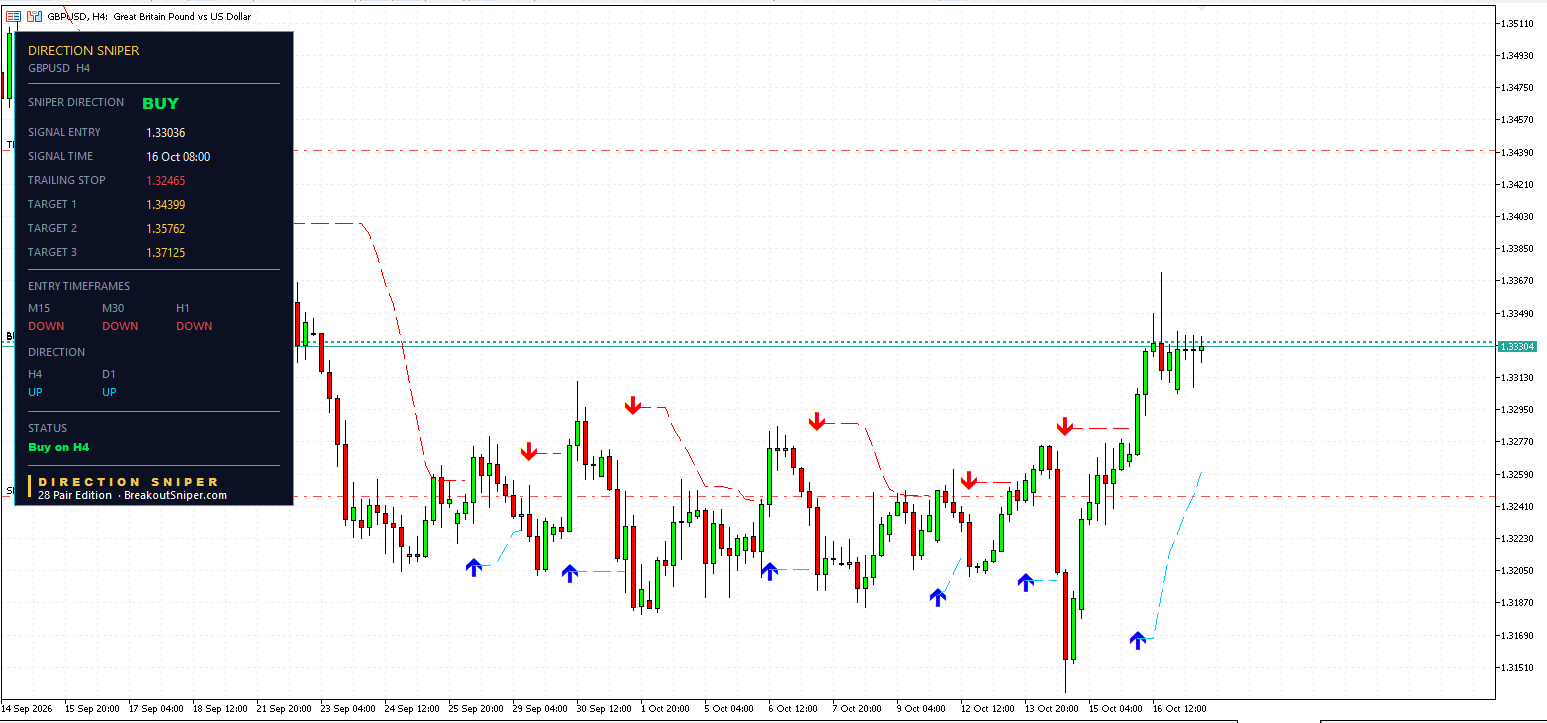
Here is how those rules look on GBP USD right now.
Step 1, the trend: UP. The 4 hour and the daily both read UP, and the verdict is BUY. After weeks of trading sideways between roughly 1.316 and 1.328, GBP USD broke higher on 15 and 16 October. The uptrend is back on.
The 4 hour buy ticket printed on 16 October at 08:00:
- Entry 1.33036
- Original stop 1.31673, so 136.3 pips of risk
- Target 1 at 1.34399, Target 2 at 1.35762, Target 3 at 1.37125
- Trailing stop now at 1.32465, tightened by 79.2 pips. That is 58 percent of the original risk already removed.
Price sits at about 1.3333, around 29 pips above the entry.
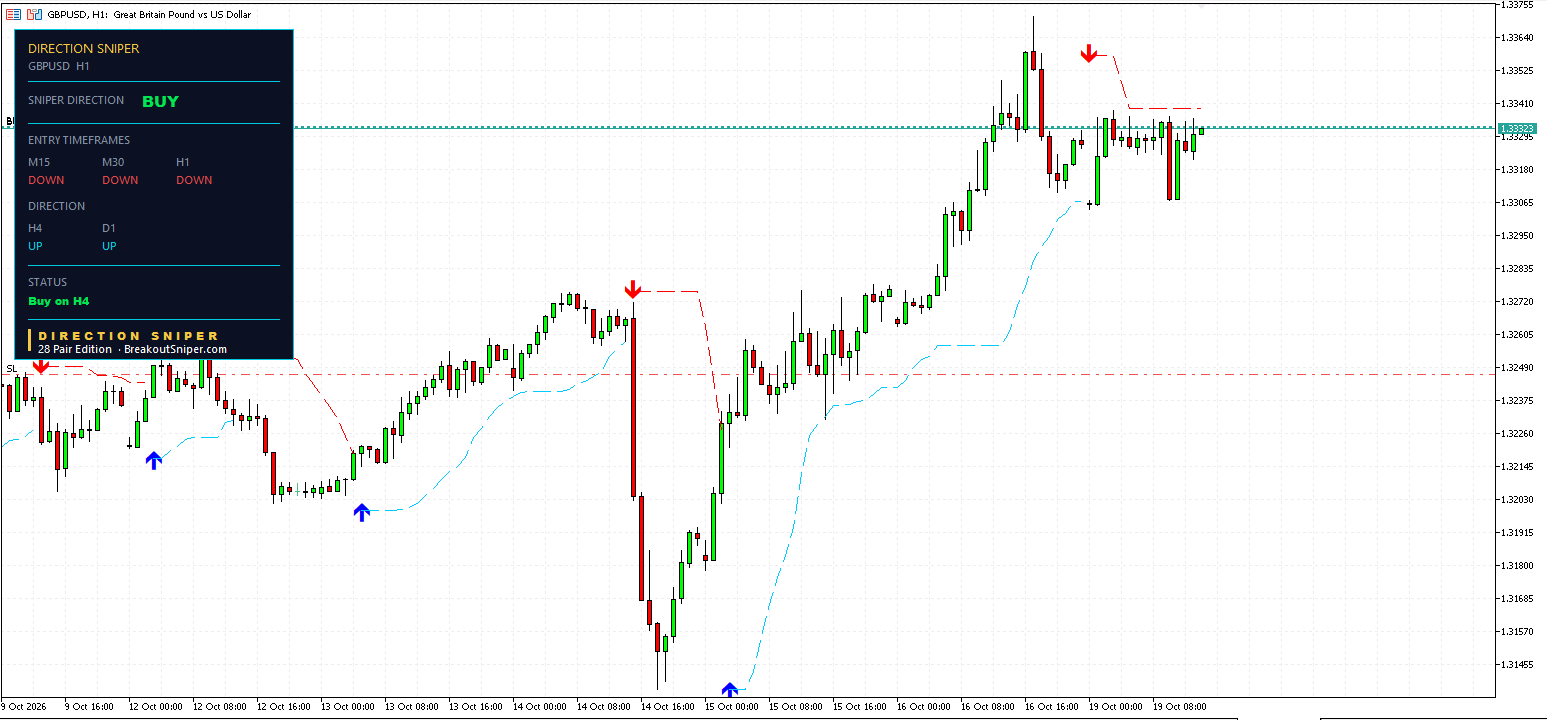
Step 2, the pullback: IN PROGRESS. GBP USD peaked around 1.3372 on 16 October and has drifted back since. The 15 minute, the 30 minute and the 1 hour all read DOWN against the BUY verdict, so the panel shows no buy ticket on them yet. The status line reads Buy on H4.
That is a pullback, exactly as the table above describes it. The fast charts have turned. The big ones have not.
Step 3: Where Would The Pullback End?
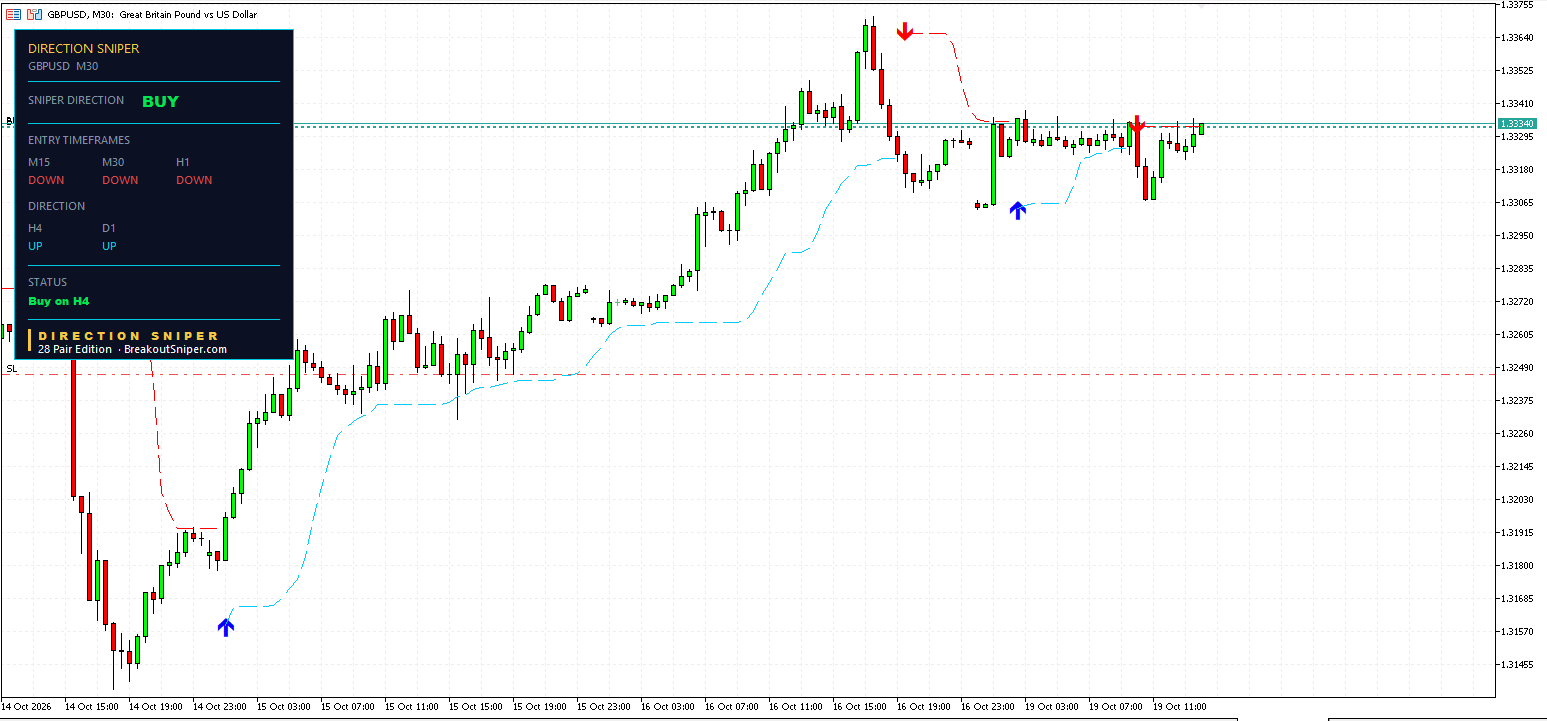
A fast chart turns back up when price closes above its red trailing line. Reading today’s charts, all three are close:
| Chart | Red trailing line | Distance from price |
|---|---|---|
| 30 minute | around 1.3333 | right at price |
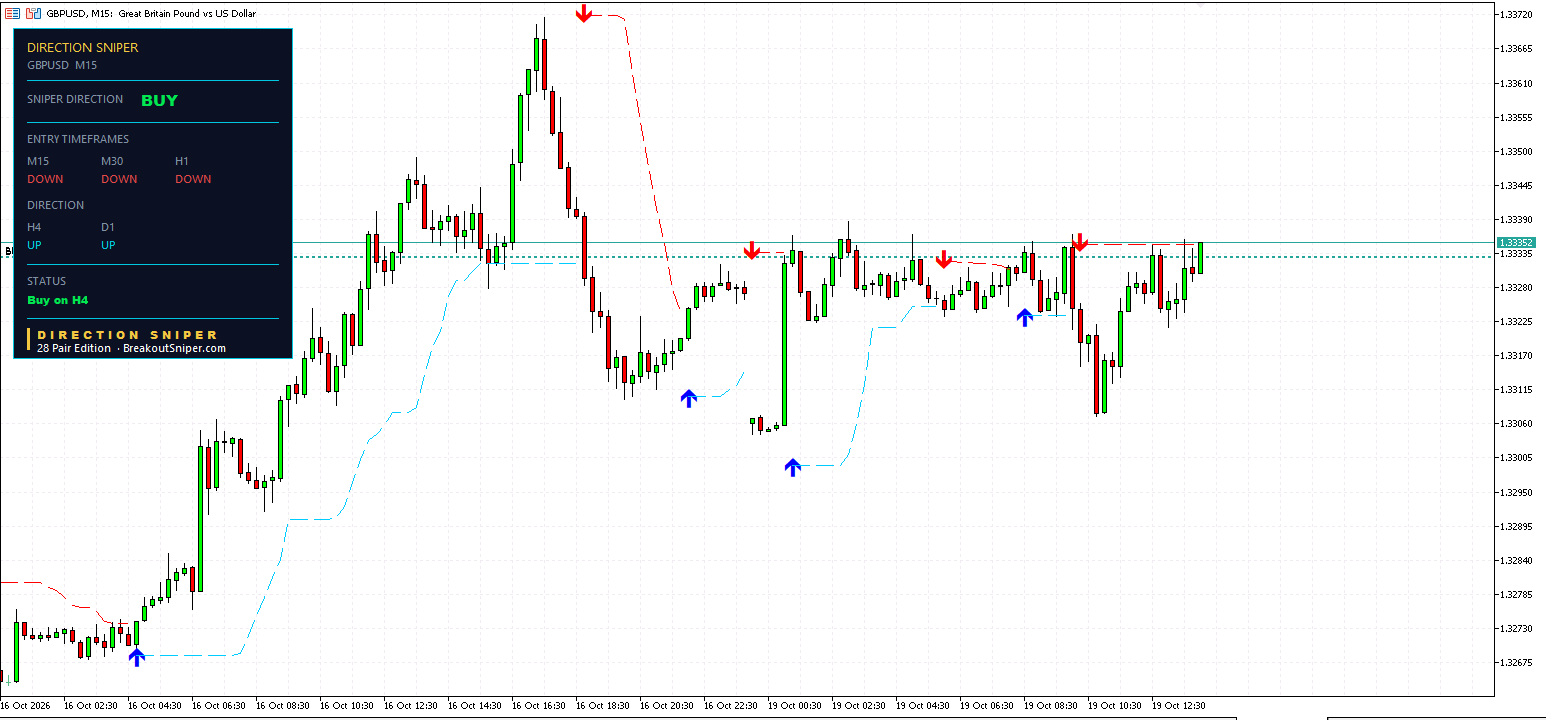
| 15 minute | around 1.3336 | about 3 pips |
| 1 hour | around 1.3339 | about 6 pips |
All three fast charts are within a few pips of lining back up with the uptrend. When one of them does, a buy ticket prints, and the alert fires on your phone.
And notice how shallow this pullback has been. It has held above roughly 1.3306, about 65 pips below the high. The 4 hour trailing stop sits much lower, at 1.32465, about 87 pips below today’s price. That gap is what a pullback inside a healthy uptrend tends to look like.
The other side, just as clearly: if price instead falls to 1.32465, the 4 hour ticket closes there, and the stay out rule applies. Both levels sit on one screen. Nobody knows which comes first, and you do not need to. The panel tells you which one happened.
How Much Should You Risk On A Pullback Trade?
A pullback entry has one big advantage: the stop is usually much tighter than a 4 hour stop, so the same dollar risk buys a bigger position. But only if you size each trade to its own stop.
We risk at most 2 percent of the account on a single trade, and usually 0.5 percent. On a 10,000 dollar account, 0.5 percent is 50 dollars. GBP USD is quoted in US dollars, so one pip on a standard lot is worth 10 dollars.
- The 4 hour ticket, 136.3 pips of risk: 50 dollars buys about 0.037 lots
- A fast chart ticket will come with a far tighter stop, so the same 50 dollars buys a larger size. Work it out from that ticket’s own stop when it prints, never from the last one.
Small account? On a 100 dollar account, 0.5 percent is 50 cents. The 4 hour ticket would need about 0.0004 lots, and the smallest standard size, 0.01 lots, would risk about 13.63 dollars. That is 13.6 percent of the account on one trade. A cent account fixes it: lot sizes work in hundredths of a standard lot, so the right size becomes possible.
We recommend a RoboForex Cent account or an XM Micro account.
We may earn a commission if you open an account through our links. It does not change the price you pay or the advice above.
Our USD CAD post this morning shows why this matters: most traders quit after a stop loss, and small risk is what keeps you in the game for the next ticket.
The Same Rule, Every Market
This is the same lesson our Bitcoin readers saw this weekend, just pointing the other way. On Bitcoin the trend was down, the fast charts turned up in a rally, and the panel held SELL. That was a bounce inside a downtrend. Read it here: Bitcoin bounce or reversal?
On GBP USD today the trend is up, the fast charts have turned down in a pullback, and the panel holds BUY.
Bounce or pullback, the rule is identical: the fast charts turn first, the big charts decide.
Where The Levels Sit Now
GBP USD (price about 1.3333)
- 4 hour BUY: entry 1.33036, Target 1 at 1.34399, trailing stop 1.32465
- Red trailing lines: 30 minute around 1.3333, 15 minute around 1.3336, 1 hour around 1.3339
- Verdict BUY. Status: Buy on H4
- Stay out line: 1.32465
Why We Publish This
Every read on this site comes straight from the Direction Sniper panel. We publish the entry, the stop and the targets as the panel shows them, and we come back to show what happened next. You can check every number against the chart yourself.
Let The Panel Tell You When The Pullback Ends
The Direction Sniper Forex Majors Edition and 28 Pair Edition both cover GBP USD.
- Direction. The 4 hour and daily verdict tells you whether you are buying a pullback or fighting a reversal.
- Pullbacks that have not broken structure. The fast charts turning down against an uptrend is the panel showing you a pullback, not a warning.
- The stop loss. Every ticket prints its stop before you enter, and the 4 hour trail on today’s ticket has already removed 58 percent of its risk.
One panel. Five timeframes. The trend, the pullback and the trigger, in one line.
See the Forex Majors and 28 Pair Editions
Want a read like this in your inbox? Join The Daily Sniper Read, free, every trading day.
Frequently Asked Questions
How do you buy a pullback?
Confirm the bigger trend is up on the 4 hour and daily charts, let price pull back until the faster charts turn down, then wait for a faster chart to turn back up before you buy.
Place your stop where the pullback would become a reversal, and size the trade so that stop costs a small, fixed share of your account.
What is a pullback in trading?
A pullback is a temporary move against the main trend.
In an uptrend, price rises, dips for a while, then continues higher, and the dip is the pullback.
Pullbacks let you buy an uptrend at a lower price, with a tighter stop, than chasing the high.
How do you tell a pullback from a reversal?
A pullback turns the fast charts. A reversal turns the big ones.
If only the 15 minute, 30 minute and 1 hour have turned down while the 4 hour and daily still point up, the uptrend is still in charge.
If the 4 hour and daily turn down as well, it is no longer a pullback, and buying it means buying against a new trend.
When should you not buy a pullback?
Stay out when the pullback goes deep enough to turn the 4 hour chart.
On the Direction Sniper panel, the 4 hour trailing stop marks that line, and if the 4 hour turns down against the daily the verdict becomes NO TRADE.
Never buy while the fast charts are still falling, because that is how traders catch a falling knife.
What is the GBP USD forecast today, 19 October 2026?
The 4 hour and daily both read UP on the Direction Sniper panel, so the verdict is BUY.
The 4 hour buy ticket from 1.33036 has its trailing stop at 1.32465, which removes 58 percent of its original risk, and its first target sits at 1.34399.
The 15 minute, 30 minute and 1 hour read DOWN in a pullback, and all three are within a few pips of turning back up.
How much should you risk on a pullback trade?
We risk at most 2 percent of the account on a single trade, and usually 0.5 percent.
On a 10,000 dollar account, 0.5 percent is 50 dollars, which on today’s 136.3 pip GBP USD 4 hour stop is about 0.037 lots.
Always size each trade to its own stop, because a pullback entry usually has a much tighter stop than a 4 hour entry.
Does a reached target mean a trader made money?
No. Price reaching a published target level is not the same as a realised result.
Fills, spreads, lot size and when each trader closed the position all change the outcome.
These posts report what the Direction Sniper panel showed, for education, and they are not a trade signal service.
Disclaimer: This post reports what the Direction Sniper panel showed on 19 October 2026. It is educational analysis, not financial advice and not a trade signal service. The 4 hour ticket was still open at the time of writing. The trailing line levels are approximate readings from the chart. Price reaching a published target level is not the same as a realised result. Lot sizes are arithmetic for illustration and are not a recommendation about how much anyone should trade. Trading carries risk, and you should only trade money you can afford to lose.

