Non Repainting Indicator For MT4 And MT5: How To Spot A Repainter Before It Costs You
A non repainting indicator is one that never changes or removes a signal once the candle it printed on has closed. What you see on the chart today is exactly what it showed live, arrow for arrow. A repainting indicator moves, redraws or deletes past signals after the fact, so its history looks far better than anything you could have traded.
That is the short answer. The long answer is a better story.
Meet The Texas Sharpshooter
There is an old joke about a cowboy who was the finest shot in Texas.
Visitors would ride out to his barn and gasp. Every single bullet hole sat dead centre of a perfectly painted target. Dozens of them. Not one miss.
Then someone watched him work. He fired at the barn wall first, wherever the bullets happened to land. Then he walked over with a paint can and painted a bullseye around each hole.
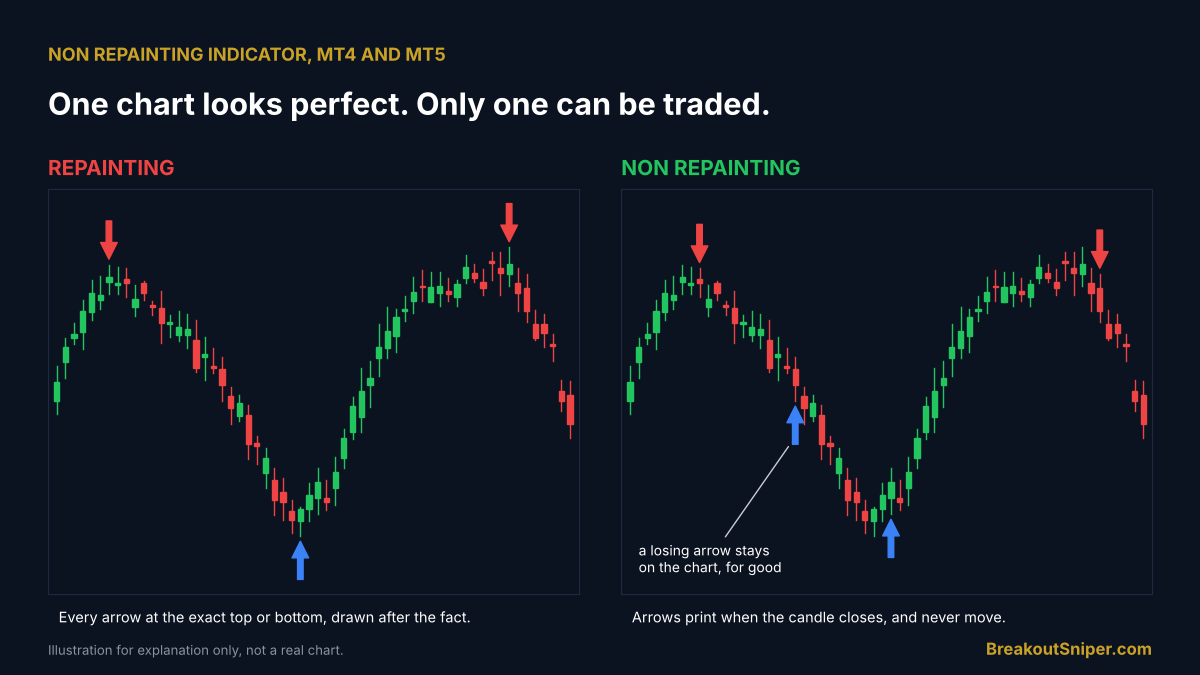
That is a repainting indicator. It fires first, waits to see where price actually went, then paints the arrow at the perfect top or bottom. Look at its chart afterwards and every arrow is a bullseye. Try to trade it live and you are standing next to the cowboy before he picks up the paint.
Keep the sharpshooter in mind. He will show up a few more times.
1. Moving On The Open Candle Is Not Repainting
Before we go further, here is the misunderstanding that confuses half the forums.
Every indicator moves while the current candle is still open. A moving average, an RSI or a MACD all recalculate with each new tick, because the candle they are measuring is not finished yet. That is normal. It is like the score of a football match changing while the game is still being played.
Repainting is when the score changes after the final whistle. A signal that printed on a closed candle moves, changes direction, or disappears. Or a signal appears on a candle that closed hours ago, as if it had been there all along.
So the right question to ask about any indicator is not “does it ever move?” It is: “Once the candle has closed, can its signal still change?” For a non repainting indicator, the answer is always no.
2. Why Repainting Indicators Exist (And What They Are Actually For)
Repainting indicators are not all scams. Some are honest tools doing an honest job. The trouble starts when they are sold for a job they cannot do.
The honest reason. Some ideas simply need the future to confirm them. You cannot know a candle was the top of a swing until price has fallen away from it for a few candles. So tools that mark swing highs and lows have to wait, then draw the mark back on the earlier candle. They are like a historian: brilliant at explaining what happened, useless at telling you what to do this morning.
Used that way, to study structure, count waves, or mark support and resistance on a finished chart, these tools are perfectly fine.
The less honest reason. A repainting chart can be made to look flawless. Every arrow at a top, every arrow at a bottom, not a single loss in sight. That makes a beautiful screenshot, and a beautiful screenshot sells. The sharpshooter’s barn makes a great postcard.
The problem is never that a tool repaints. It is when a tool that repaints is sold as an entry signal. A historian makes a terrible weather forecaster.
3. Which Indicators Repaint?
Here is a plain guide to the common types.
| Indicator type | Does it repaint? | Why | Best used for |
|---|---|---|---|
| ZigZag | Yes | The last leg keeps redrawing as new highs and lows form | Studying past swings, not live entries |
| Fractals | Marks the past | A fractal can only be confirmed a couple of candles later, then is drawn back on the earlier candle | Marking swing points, knowing they are late |
| Centred moving averages | Yes | Recent values change as new candles arrive | Smoothing history for analysis |
| Multi timeframe indicators | Often | Values on a fast chart can change until the higher timeframe candle closes, unless the tool reads closed higher timeframe candles only | Fine if built on closed candles, risky if not |
| Any indicator that signals on the open candle | Flickers | The arrow can appear and vanish before the candle closes | Wait for the close before acting |
| Standard moving averages, RSI, MACD, Bollinger Bands | No, on closed candles | Closed values are fixed. Only the open candle moves | Live trading, read on closed candles |
The rule of thumb: if a tool needs future candles to confirm something, it either repaints or draws its marks late. Neither is a crime, as long as you know which one you are using.
4. How Repainting Fools You
The sharpshooter does not fool anyone who watches him shoot. He fools people who only see the barn afterwards. Repainting fools traders in three quiet ways.
The perfect chart. You load the indicator on a chart, scroll back, and every arrow is a bullseye. You think you have found the holy grail. In reality you are looking at a highlight reel, edited after the match, with every miss cut out.
The ghost alert. Your phone buzzes: “BUY EURUSD.” You check the chart a few minutes later and there is no arrow. The signal fired while the candle was open, then vanished when the candle closed. You are either in a trade the indicator no longer shows, or you missed one that suddenly appears three candles back. Either way, the chart and your account no longer agree.
The backtest that lies. Run a repainting indicator in the Strategy Tester, or build an EA on it, and the equity curve can look like a staircase to the sky. The tester is effectively letting the indicator peek at the future, the way an exam would be easy if you could read the marking scheme first. Traders call this look ahead bias. Then the EA goes live, the future is no longer visible, and the staircase becomes a slide.
All three end the same way: confidence built on results that never existed.
5. Why A Non Repainting Indicator Benefits You
A non repainting indicator is less glamorous. Its chart shows the misses as well as the hits. That is exactly why it is worth more.
- What you see is what you would have got. The history on your chart is the history you could have traded. Your study of past signals is honest study.
- Alerts match the chart. When the alert arrives, the arrow is there, and it stays there.
- Your journal and your backtests tell the truth. You can judge a method on real results, losses included, before you trust it with money.
- The stop is known at the close. When the candle closes and the signal prints, the entry and stop are fixed. That means your lot size can be fixed too, which is the single most important number in trading. We explain why in blowing up your trading account.
- Trust makes discipline easier. You cannot follow rules you do not trust. A tool that never rewrites its own history is a tool you can follow on the bad days too.
The Honest Trade Off: You Wait For The Close
Here is the part most sellers never mention. A non repainting signal comes a little later. It waits for the candle to close, so it can never catch the exact top or the exact bottom. The sharpshooter’s arrows always look sharper.
You give up a few pips of entry. In return, you get a signal that will still be there tomorrow, and a stop that is known before you risk a cent. A slightly later entry you can actually take beats a perfect entry that only exists in hindsight.
It is the difference between a photo finish and a winner announced while the runners are still running.
6. A Real Example: The Losing Trade That Stayed On The Chart
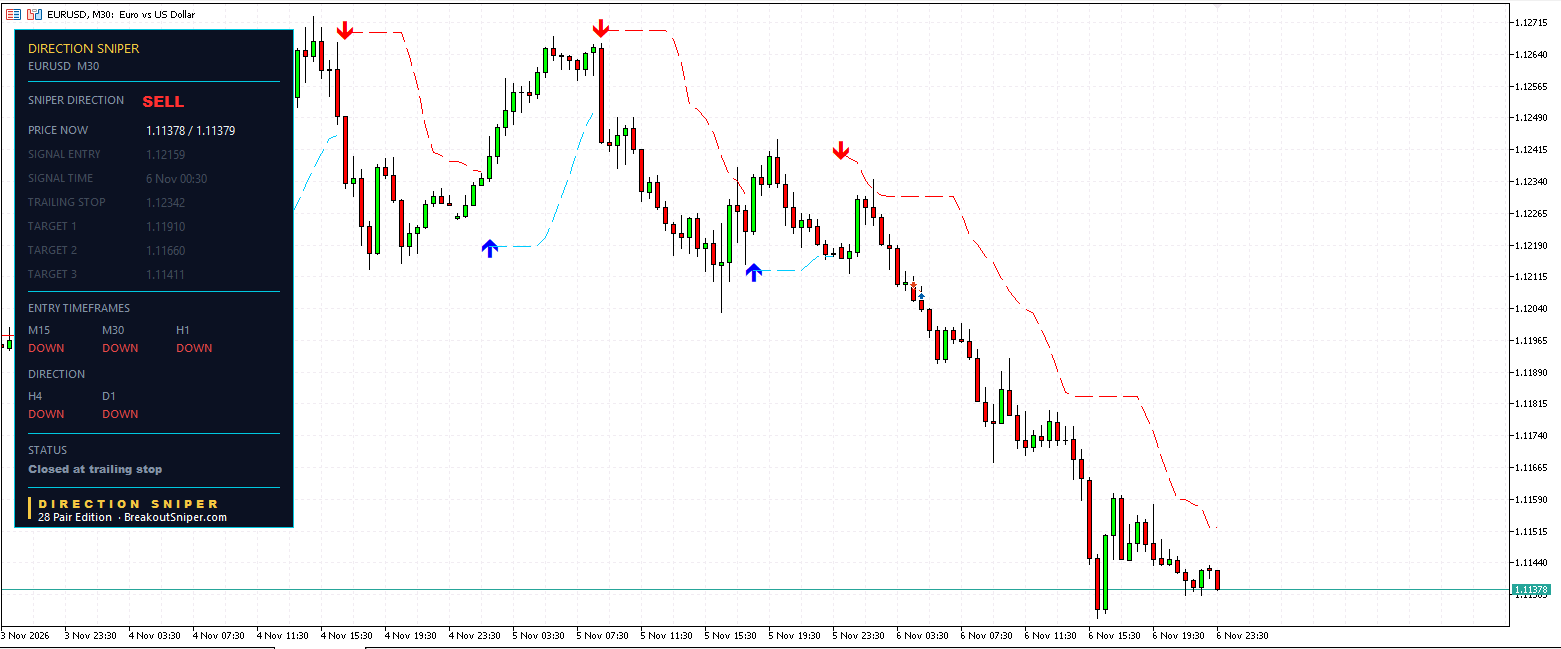
Here is a real EURUSD 30 minute chart with the Direction Sniper panel.
The verdict reads SELL, and every timeframe agrees: the 15 minute, 30 minute, 1 hour, 4 hour and daily all read DOWN. From the last big sell arrow, near 1.1240, EURUSD fell to 1.11378, around 100 pips lower.
Now look closely at the panel.
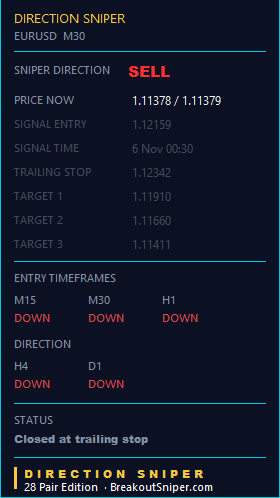
| Ticket (M30) | Level |
|---|---|
| Entry | 1.12159 |
| Original stop | 1.12408 |
| Trailing stop level when it closed | 1.12342 |
| Target 1, 2, 3 | 1.11910, 1.11660, 1.11411 |
| Status | Closed at trailing stop |
This ticket did not work. Price bounced after the entry and touched the trailing stop level at 1.12342, 18.3 pips against the entry. The trailing stop had already moved 6.6 pips in from the original stop, so on a $50 risk the loss was about $37 instead of the full $50. Then, of course, price fell another 78 pips without it.
And here is the point. The ticket is still on the chart. Greyed out, marked “Closed at trailing stop,” exactly where it printed. Nothing was redrawn, nothing was moved to a better spot, nothing was quietly deleted.
A repainting indicator would have painted a fresh bullseye at the top of that bounce and erased the losing trade, and the chart would look perfect. It would also be a lie.
This is what honesty looks like on a chart: the direction was right, the move came, one entry got caught by a bounce, and all of it stays on record. That is the chart you can learn from.
For sizing this kind of ticket, the stop distance from entry to the original stop was 24.9 pips. At $50 of risk that is $50 / (24.9 x $10) = 0.20 lots. Work out any pair in seconds with our free EURUSD Lot Size Calculator.
7. Four Tests To Spot A Repainter
You do not need to read code to catch the sharpshooter. You only need to watch him shoot.
- The candle close test. Put the indicator on a 5 minute or 15 minute chart and watch a few candles close in real time. If an arrow appears mid candle and then disappears, or a new arrow appears on a candle that closed earlier, it repaints.
- The screenshot test. Take a screenshot of the chart today, with a few recent arrows on it. Tomorrow, scroll back to the same candles and compare. If any arrow has moved, changed colour, or vanished, it repaints.
- The Strategy Tester test. Run the indicator in the Strategy Tester’s visual mode and watch the arrows appear as the test plays. When it finishes, compare those arrows with what the finished chart shows. If the finished chart looks better than what you watched happen, the indicator repainted along the way.
- The alert test. Keep a simple log of every alert for a few days: time, pair, direction. Then check each one against the chart. Every alert should have an arrow, on a closed candle, in the same place. Ghost alerts give a repainter away.
Run all four before you trust any indicator with real money, ours included.
8. Before You Buy Any Indicator: The Checklist
The sharpshooter’s barn makes a lovely sales page. Here are the questions that check whether you are looking at one.
- Does it signal only on closed candles? Ask the seller directly: on which candle does the signal print?
- Can you see its losing trades on the chart? If every arrow in every screenshot is perfect, be suspicious. Real indicators lose. Honest ones show it.
- Does the seller publish live, dated readings? Not screenshots of the past, but readings published at the time, that you can check later.
- Do the alerts match the chart afterwards? Ask for that before you rely on it.
- What does “100% non repaint” mean on the label? Some tools only stop moving once the candle closes, but give the signal on the open candle. That can be “true” on paper and still leave you chasing arrows that vanish.
We publish what the Direction Sniper panel shows every trading day, with the levels, in our Currency Strength Today and Gold and Silver Price Forecast reads. Check them against the charts a week later. That is the test we would want any seller to pass.
9. A Quick Note For TradingView Users
The same idea applies on TradingView. Scripts can repaint when they behave differently on live candles than on historical ones, or when they pull data from a higher timeframe candle that has not closed yet. You will sometimes see the word “backpainting” for scripts that draw values back into the past. The four tests above work there too: watch a candle close, screenshot and compare, and check alerts against the chart.
Trust The Chart That Shows Its Misses
The sharpshooter’s barn will always look better than a real shooter’s target. That is exactly why you should not trust it.
A non repainting indicator gives you a chart that tells the truth, alerts that match it, and a stop you know before the trade exists. That is what Direction Sniper is built around. Its arrows, tickets and trailing stop moves wait for the candle to close, and its direction is read from closed 4 hour and daily candles.
- Direction. One verdict from the 4 hour and the daily on every pair, read on closed candles only, so the verdict you see on the chart is the verdict it gave at the time.
- Bounces that are not reversals. When the fast charts swing against the trend, the verdict holds until the bigger charts change. On the EURUSD chart above, the bounce caught one entry, and the direction still delivered the move.
- The stop loss. Every ticket arrives with its entry, stop and three targets marked, on a closed candle. The panel then calculates and displays the trailing stop level as the trade develops, and you move your own stop to match it. When a ticket closes, it stays on the chart for good.
The 28 Pair Edition puts this panel on all 28 forex pairs, MT4 or MT5, on one licence.
Want to watch the panel’s readings published live, then check them yourself later? Get the free Currency Strength Scanner newsletter.
More guides on reading direction, managing trades and sizing positions: Trading Guides.
Non Repainting Indicators: Frequently Asked Questions
1What is a non repainting indicator?+
A non repainting indicator never changes or removes a signal once the candle it printed on has closed. What you see on the chart later is exactly what it showed live.
A repainting indicator moves, redraws or deletes past signals after the fact, so its history looks better than anything you could have traded.
2Is it repainting if an indicator moves on the current candle?+
No. Every indicator recalculates while the current candle is still open, because that candle is not finished. Repainting is when a signal on a closed candle changes or disappears.
The question to ask is whether a signal can still change after the candle has closed.
3How do I check if an indicator repaints on MT4 or MT5?+
Watch a few candles close in real time, take a screenshot and compare it the next day, run the indicator in the Strategy Tester visual mode, and log its alerts to check against the chart.
If an arrow moves, vanishes or appears on an earlier candle, the indicator repaints.
4Why do some indicators repaint?+
Some ideas need future candles to confirm them, such as a swing high or low, so tools like ZigZag redraw or mark the past late. That makes them useful for studying history, not for live entries.
Repainting also makes charts look flawless, which is why some indicators are sold with perfect looking screenshots.
5Does Heikin Ashi repaint?+
Closed Heikin Ashi candles do not change; only the current candle moves while it is open.
Remember that Heikin Ashi candles are averaged, so their prices are not the real prices your broker fills at.
6Does Supertrend repaint?+
A standard Supertrend does not change its values on closed candles, but it can flip direction during the open candle and flip back before it closes.
Act on it only after the candle has closed.
7Does RSI repaint?+
No. RSI values on closed candles are fixed. The value on the current candle moves until that candle closes, which is normal and not repainting.
8Why does a non repainting signal come later?+
Because it waits for the candle to close before it prints. You give up a few pips of entry, and in return you get a signal that never moves and a stop that is known before you enter.
A slightly later entry you can actually take beats a perfect entry that only exists in hindsight.
9Does Direction Sniper repaint?+
No. Direction Sniper prints its arrows, tickets and trailing stop moves only after the candle closes, and reads its direction from closed 4 hour and daily candles.
Closed tickets stay on the chart, losing ones included, exactly where they printed.
DIRECTION SNIPER 28 PAIR EDITION
Arrows that wait for the close, and never move after it.
One verdict on all 28 pairs, and every ticket printed on a closed candle with its entry, stop loss and three targets. MT4 or MT5, one licence.
Disclaimer: This guide is educational content, not financial advice and not a trade signal service. The EURUSD chart shows what the Direction Sniper panel displayed when the screenshot was taken. Price reaching a level on the chart is not the same as a realised result. Pip values and lot sizes are arithmetic for illustration, depend on the pair and your broker, and are not a recommendation about how much anyone should trade. Trading forex and other leveraged products carries a high level of risk, and you should only trade money you can afford to lose.