NZD USD Forecast Today, 17 November 2026: Star Pick Replay On Four Charts, And How The 1 Hour Sell Reached All Three Targets
This NZD USD forecast today replays our Star Pick across all four Direction Sniper charts. The 4 hour sell from 11 November has reached Target 1 and is still running, with its trailing stop 51.3 pips in front. The 1 hour sell from 12 November reached all three targets: 52.5 pips on a 17.5 pip stop. And today, the 30 minute and 15 minute both printed fresh sells and reached Target 1 within the hour. Every NZDUSD chart, from the 15 minute to the daily, still reads DOWN. Here is the whole shot, frame by frame, and what we watch for next.
✔ All 3 targets, 52.5 pips on 17.5
🛡 Target 1 reached, trailing stop 51.3 pips in front
✔ Fresh today, Target 1 within the hour
Replay of 12 to 17 November 2026.
A wildlife photographer will tell you the best shot of the day is never the lucky one.
It is the one they planned. They knew where the bird would land, framed it, set the focus, and waited. When the moment came, it took a fraction of a second, because everything else was already done.
This replay is that kind of shot, taken four times on four lenses. Nothing about it was lucky. By the end of section 5, you will see the three things that were in place before the arrow printed, and why the same three things are what we look for in every pair in the crosshairs.
1. Why NZDUSD Is Today’s Star Pick
The Star Pick is chosen by the board, not by the result. It is the highest rated pair on today’s Direction Scanner, replayed from its arrow to its outcome, whatever happened. On days it ends at a stop, we replay that too.
Today, NZDUSD is rated highest of all 18 trending pairs. The US dollar is joint strongest on our board and the New Zealand dollar is second weakest. It was also yesterday’s Pick of the Day in our currency strength read for 16 November. Read today’s full board in currency strength today.
2. The Replay: Frame By Frame
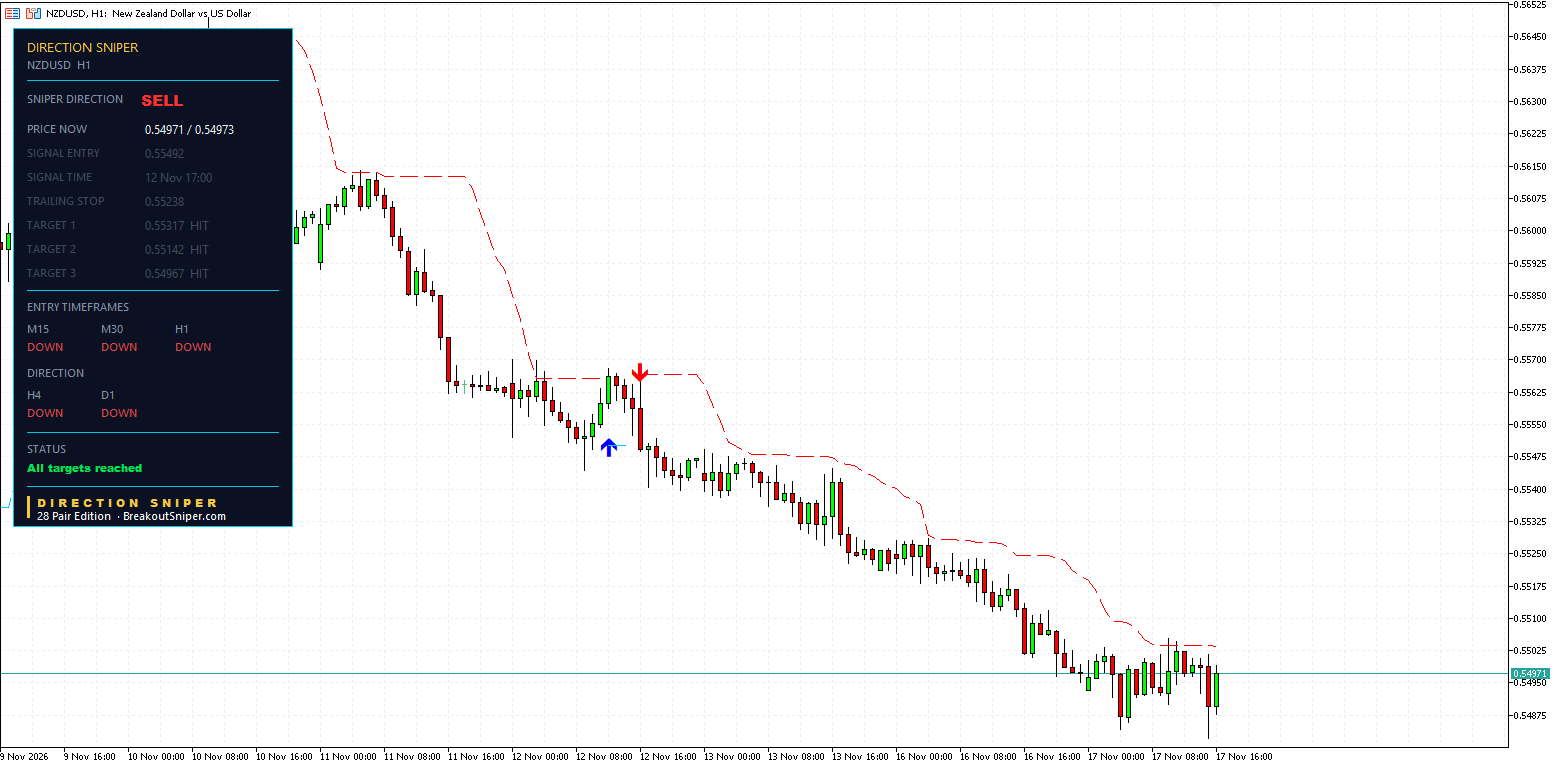
Frame 1: the direction. By 12 November, NZDUSD’s 4 hour and daily both read DOWN. The dollar was strong and the New Zealand dollar was weak. The direction was set before any entry.
Frame 2: the bounce. On 12 November, NZDUSD rallied to around 0.5566. On a chart, a rally like that can look like the start of a turn. The 4 hour and the daily did not agree. They never turned.
Frame 3: the arrow. At 17:00 on 12 November, as the bounce ran out, the 1 hour printed a sell at 0.55492.
| Level | Distance from entry | |
|---|---|---|
| Original stop | 0.55667 | 17.5 pips |
| Target 1 | 0.55317 | 17.5 pips, reached |
| Target 2 | 0.55142 | 35.0 pips, reached |
| Target 3 | 0.54967 | 52.5 pips, reached |
Frame 4: the ride. For five days, NZDUSD stepped lower. It paused, bounced and paused again, on 13 November, 16 November and again today. The panel’s trailing stop followed price down above it the whole way, and no bounce reached it.
Frame 5: the finish. Today, NZDUSD reached Target 3 at 0.54967. The status reads All targets reached.
That is 52.5 pips on a 17.5 pip stop: three times the risk. Under our partial exit model (half at Target 1, 30 percent at Target 2, 20 percent at Target 3), that is +1.70R.
The honest part. This 1 hour ticket printed on 12 November and reached its targets before we wrote about it, so it is shown to explain, not counted in our Currency Strength Performance Record. The Star Pick is a replay, not a claim.
3. The 4 Hour: The Lens That Set The Direction
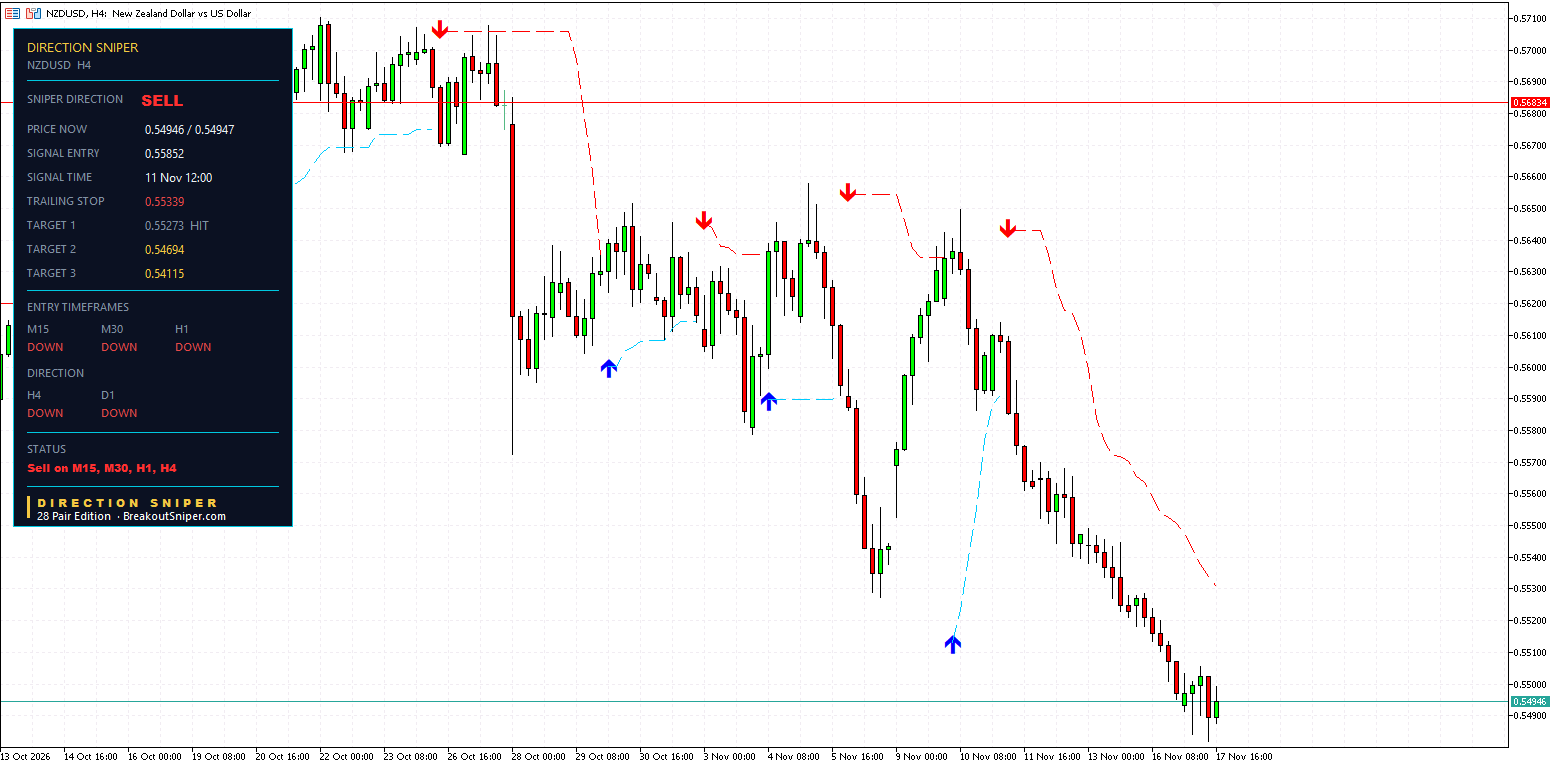
The 4 hour is the wide lens. Its sell printed at 12:00 on 11 November at 0.55852, after NZDUSD failed to hold a rally above 0.5640.
- Original stop: 0.56431, 57.9 pips above the entry
- Target 1: 0.55273, reached
- Target 2: 0.54694
- Target 3: 0.54115
- Trailing stop now: 0.55339, 51.3 pips in front of the entry
NZDUSD is at about 0.5495, 90.6 pips below the entry and 25.2 pips from Target 2. At the panel’s level, this ticket can no longer close behind its entry. If it closed at its trailing stop now, the panel’s result under our model would be about +0.94R, and it is still running.
This is the ticket that gave the direction to everything else on this page. The 1 hour, 30 minute and 15 minute tickets all sell in the same direction, inside the move the 4 hour started.
4. The 30 Minute And 15 Minute: Fresh Today, Target 1 Within The Hour
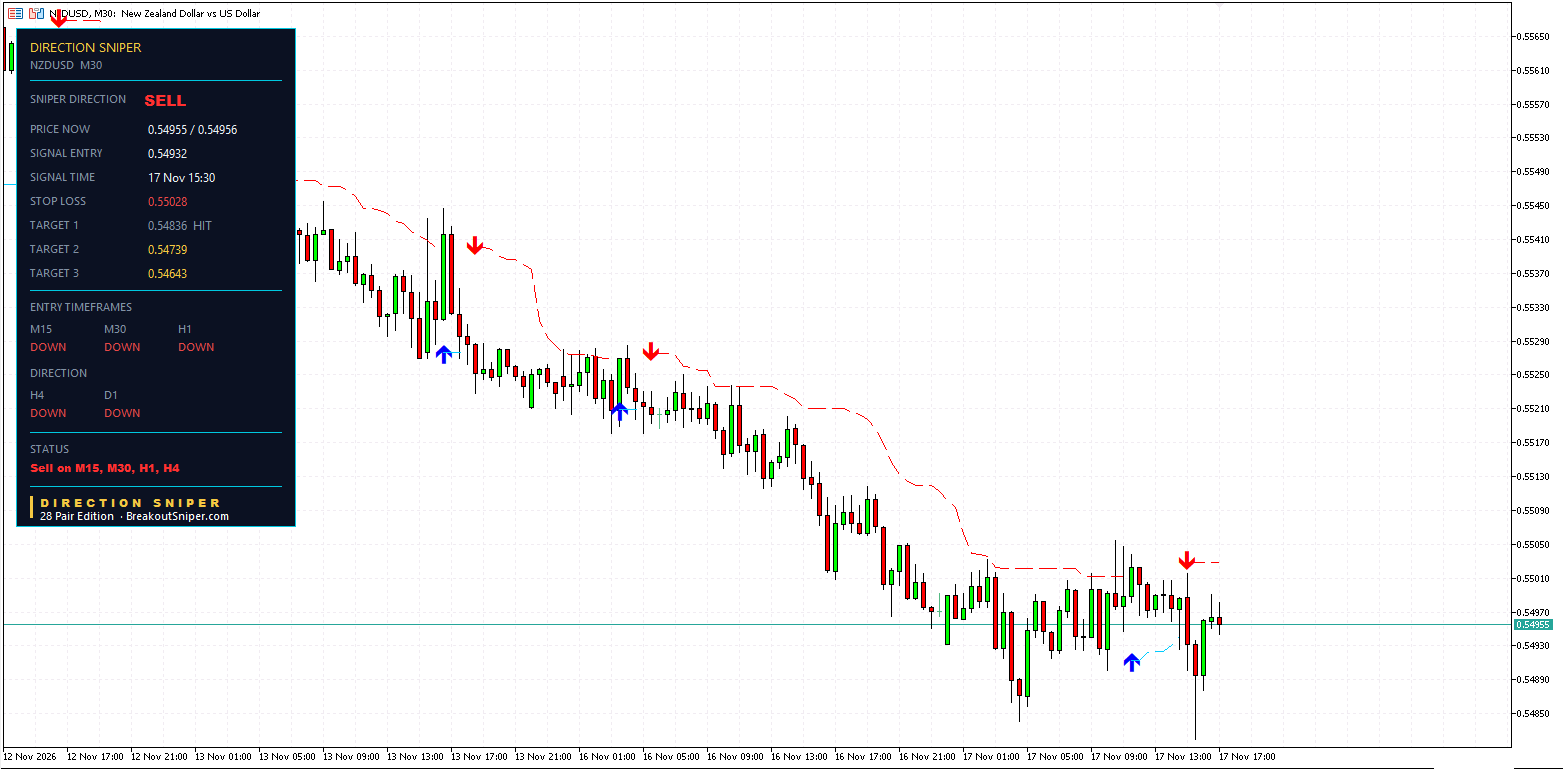

Today, NZDUSD bounced again, briefly back above 0.5500. At 15:30 on 17 November, both the 30 minute and the 15 minute printed a sell at 0.54932.
| 30 minute | 15 minute | |
|---|---|---|
| Entry | 0.54932 | 0.54932 |
| Stop | 0.55028, 9.6 pips | 0.55004, 7.2 pips |
| Target 1 | 0.54836, reached | 0.54860, reached |
| Target 2 | 0.54739 | 0.54788 |
| Target 3 | 0.54643 | 0.54716 |
Within the same hour, NZDUSD dropped to around 0.5483 and both reached Target 1. Then it bounced again, and it now sits at about 0.5495, a couple of pips above both entries.
Here is the part worth understanding. Under our partial exit model, half of each ticket closes at Target 1. So even if the other half now reaches its stop, the ticket ends about level: the half closed at Target 1 covers the half that would close at the stop. Reaching Target 1 quickly is what turns a small timeframe ticket into one that cannot cost the full planned risk.
These two tickets printed before today’s read and reached Target 1 before we wrote about them, so like the 1 hour, they are shown to explain, not counted.
5. What Was In Place Before The Arrow
Three things, all visible before the shot fired:
- A strong currency against a weak one. The dollar near the top of our board, the New Zealand dollar near the bottom.
- The bigger charts agreeing. The 4 hour and the daily both DOWN, and they stayed DOWN through the bounce.
- A bounce that did not break structure. The 12 November rally looked like a turn on the 1 hour. The bigger charts said otherwise, and the arrow printed as it ran out.
Those are the same three things that put a pair in the crosshairs on our board. Today that is EURAUD, USDCAD and GBPUSD: direction set, waiting for the 1 hour trigger.
6. What Now For NZD USD?
Every chart still reads DOWN. The 4 hour ticket is running toward Target 2, the 1 hour has finished, and the 30 minute and 15 minute are running past Target 1 with price back near their entries. A new sell placed here, far from the 4 hour and 1 hour entries, would have its stop well away and the next target close.
So we watch for the next frame: a bounce, then a fresh 1 hour sell arrow, the same pattern as 12 November. What would change the picture:
- The 4 hour turning UP. Then the sell read ends.
- The US dollar slipping from the top of our currency strength board, or the New Zealand dollar climbing off the bottom.
This is the level we are watching, not a trade recommendation.
7. Lot Size: Four Tickets, Four Sizes
We risk at most 2 percent per trade, usually 0.5 percent, so on a $10,000 account that is $50. One pip on a standard NZDUSD lot is $10.
| Ticket | Stop distance | Lot size for $50 |
|---|---|---|
| 15 minute | 7.2 pips | about 0.69 lots |
| 30 minute | 9.6 pips | about 0.52 lots |
| 1 hour | 17.5 pips | about 0.28 lots |
| 4 hour | 57.9 pips | about 0.08 lots |
Four lenses, four sizes, one identical risk, each worked out the moment its arrow printed. Notice how large the 15 minute lot looks. A 7 pip stop is close enough for one bounce to reach it, which is exactly why its half at Target 1 matters so much. The photographer sets the shutter speed before the bird moves, not after.
Always round down, never up. Work out your own size in seconds with our free NZDUSD Lot Size Calculator.
If you are worrying about every trade, your lot size is still too big.
Planned, Not Lucky
The direction was set. The bounce did not break it. The arrow printed as the bounce ran out, with the stop and three targets marked. Five days later, every target was reached.
That is Direction Sniper:
- Direction. One verdict from the 4 hour and the daily. NZDUSD has read DOWN on both for days, and four timeframes sold in the same direction.
- Rallies and bounces that have not broken structure. The 12 November rally looked like a turn. The panel did not.
- The stop loss. The ticket arrived with its stop and three targets marked, so the size was decided before the move.
The 28 Pair Edition puts this panel on NZDUSD and every other major, minor and cross, MT4 or MT5, on one licence, with alerts to your phone the moment the next arrow prints.
Want tomorrow’s read in your inbox, with the pairs that fired? Join The Daily Sniper Read, free, every trading day.
NZD USD Forecast Today: Frequently Asked Questions
Updated 17 November 2026. Levels are as shown on the Direction Sniper panel at the time of writing.
1What is the NZD USD forecast today, 17 November 2026?+
Every NZDUSD chart on the Direction Sniper panel reads DOWN, from the 15 minute to the daily, so the direction is SELL. The US dollar is joint strongest on our currency strength board and the New Zealand dollar is second weakest.
The 1 hour ticket has finished, so we wait for the next bounce and a fresh 1 hour sell.
2Did NZDUSD reach all three targets?+
Yes, on the 1 hour. The sell from 0.55492 on 12 November reached 0.55317, 0.55142 and 0.54967: 52.5 pips on a 17.5 pip stop.
Under our 50/30/20 partial exit model, that is +1.70R. It is a replay, shown to explain, and not counted in our record.
3What is the Star Pick?+
The Star Pick is the highest rated pair on our Direction Scanner, replayed from its arrow to its result, whatever happened.
It is chosen by the board, not by the result, and days that end at a stop are replayed too.
4Is the NZDUSD 4 hour sell still running?+
Yes. The 4 hour SELL from 0.55852 on 11 November has reached Target 1 at 0.55273, and its trailing stop is 0.55339, 51.3 pips in front of the entry. NZDUSD is about 25 pips from Target 2 at 0.54694.
This is not a trade recommendation.
5What happened on the NZDUSD 15 minute and 30 minute?+
Both printed a SELL at 0.54932 at 15:30 on 17 November and reached Target 1 within the hour, at 0.54860 and 0.54836. Price then bounced back near the entries.
With half of each ticket closed at Target 1 under our model, even a stop on the rest would end each ticket about level.
6Is it too late to sell NZDUSD?+
The 1 hour ticket has finished and price is far from its entry. A new sell here would have its stop well away and the next target close.
We watch for a bounce and a fresh 1 hour sell arrow, the same pattern as 12 November.
7What lot size fits each NZDUSD ticket?+
We risk at most 2 percent per trade, usually 0.5 percent, which is $50 on a $10,000 account. With $10 per pip on a standard lot, that is about 0.69 lots on the 15 minute, 0.52 on the 30 minute, 0.28 on the 1 hour and 0.08 on the 4 hour.
Use the NZDUSD Lot Size Calculator to check your own size.
DIRECTION SNIPER 28 PAIR EDITION
See NZDUSD and 27 more pairs the moment a ticket prints.
Direction, entry, stop and three targets on all 28 pairs. MT4 or MT5, one licence.
Disclaimer: This post replays what the Direction Sniper panel showed on NZDUSD between 12 and 17 November 2026. The ticket replayed here was not published in advance and is not counted in our record. Results are measured in R, multiples of the original risk, using a fixed partial exit model of 50 percent at Target 1, 30 percent at Target 2 and 20 percent at Target 3, and are not the results of any trading account. Spread, commission and slippage are not included. Price reaching a target or stop level is not the same as a realised result. Past results do not guarantee future results. It is educational analysis, not financial advice and not a trade signal service, and nothing here is a recommendation to buy or sell. Lot sizes are arithmetic for illustration at 0.5 percent of a $10,000 account. Forex trading carries risk, and you should only trade money you can afford to lose.