
Bitcoin and Ethereum are both on a BUY verdict today, and this time every timeframe agrees. Yesterday the panel had the bigger timeframes up and was waiting for buy signals on M15, M30 and H1. Those signals arrived, and both coins have broken out. Readings as of 21 September 2026.
How to Read the Chart
The panel on the left gives the verdict. The H4 and daily set the direction, and the entry timeframes (M15, M30 and H1) are where the timing signals appear. On the chart itself, a red arrow marks where that timeframe turned down, and the red dashed line then follows price from above. A blue arrow marks a turn up, with the blue line following from below.
When a signal agrees with the verdict, the panel builds a trade ticket: a signal entry, a stop loss, and three targets measured from the stop distance. Targets are marked HIT once price reaches them.
Bitcoin and Ethereum trade seven days a week, so weekend candles count toward these readings.
Bitcoin Price Forecast Today (BTCUSD) 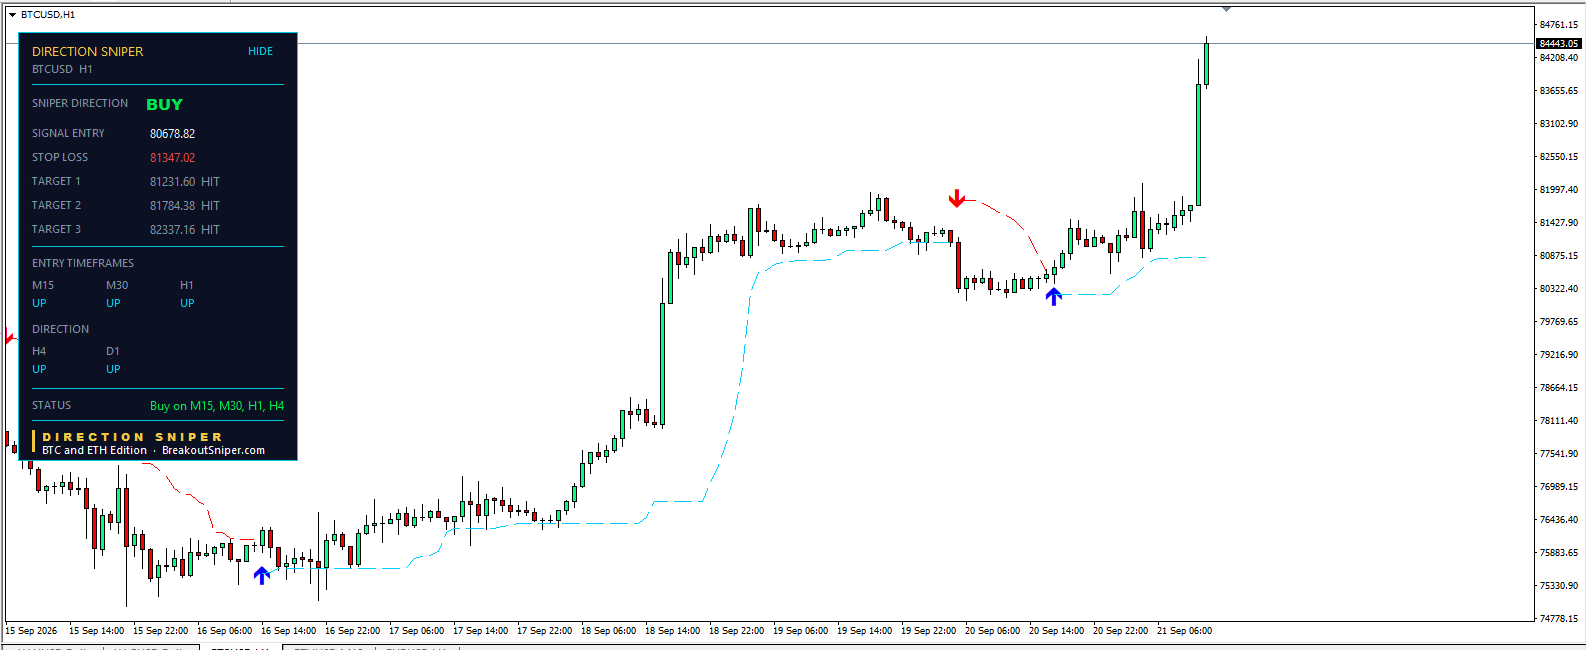
Direction Sniper reads BUY on Bitcoin. Status: Buy on M15, M30, H1 and H4.
Every field on the panel points the same way. H4 and D1 are both UP, and M15, M30 and H1 are all UP. Yesterday only the H4 agreed with the verdict. Today all four do.
Price is at 84,443.05.
The Signal That Was Missing Yesterday
Yesterday’s read said the direction was up and the timing was not there, and that the panel would produce a ticket the moment an entry timeframe turned back up while the bigger timeframes held.
That is what happened. A red arrow had printed on H1 late on 19 September near 81,900 and pulled price back to around 80,200. Around midday on 20 September, a blue arrow printed on H1 in the direction of the verdict, and the panel built this ticket:
- Signal entry: 80,678.82
- Stop at entry: around 80,126
- Target 1: 81,231.60, marked HIT
- Target 2: 81,784.38, marked HIT
- Target 3: 82,337.16, marked HIT
Each target sits about 553 points above the last, the same distance as the entry to the stop.
The stop loss field now reads 81,347.02, which is above the signal entry. That is the current trailing level, not the original stop. On a buy, a trailing level above entry means the stop has followed price into profit.
These levels are the indicator’s output, shown so you can see how the ticket is built, not an instruction to trade.
The Range Finally Broke
The bigger story is where price has gone since. Bitcoin spent almost a month trapped between roughly 75,000 and 82,300, and every push into the top of that range was turned back.
Today’s candle cleared it. Price is at 84,443, well above the old ceiling and above the third target. The range that defined the last three weeks is now below price.
What Changes the Picture
With all four timeframes agreeing, the next thing to watch is the first one to disagree. If H1 or M30 turns down, the fast charts are pulling back inside an uptrend. If the H4 turns down, the verdict becomes NO TRADE and the panel stands aside. A return below the old range top near 82,300 would turn the breakout into a failed one, since a level that was resistance should now hold as support.
About the panel: These readings come from the Direction Sniper panel, Bitcoin and Ethereum Edition, which shows the direction on the 4 hour and daily charts and the entry timeframes for BTCUSD and ETHUSD on MetaTrader 4 and MT5.
Ethereum Price Forecast Today (ETHUSD)
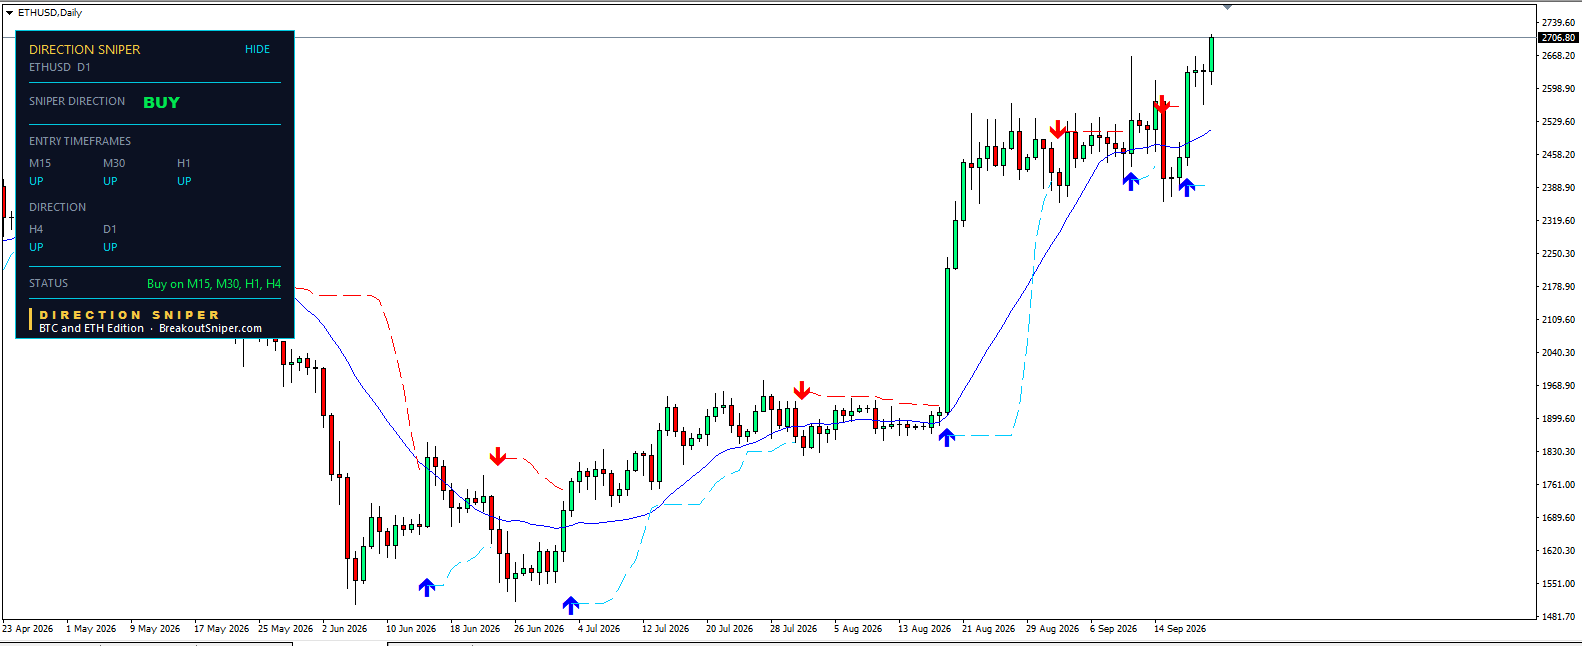
Ethereum reads the same as Bitcoin, field for field. BUY, with H4 and D1 up and all three entry timeframes up. Status: Buy on M15, M30, H1 and H4.
Price is at 2,706.80 on the daily, which is a new high for this run.
The daily chart shows how Ethereum got here. A blue arrow printed in mid August near 1,890 and started the move from roughly 1,900 to 2,450 in a handful of candles. A red arrow followed at the end of August near 2,530, then blue arrows printed around 9 September near 2,420 and again around 16 September near 2,400. Price has since cleared the early September high and pushed into 2,700.
Two Tickets on Ethereum, One Finished and One Still Open
Ethereum produced signals on two entry timeframes, and they show different stages of the same move.
The M30 ticket, all three targets reached
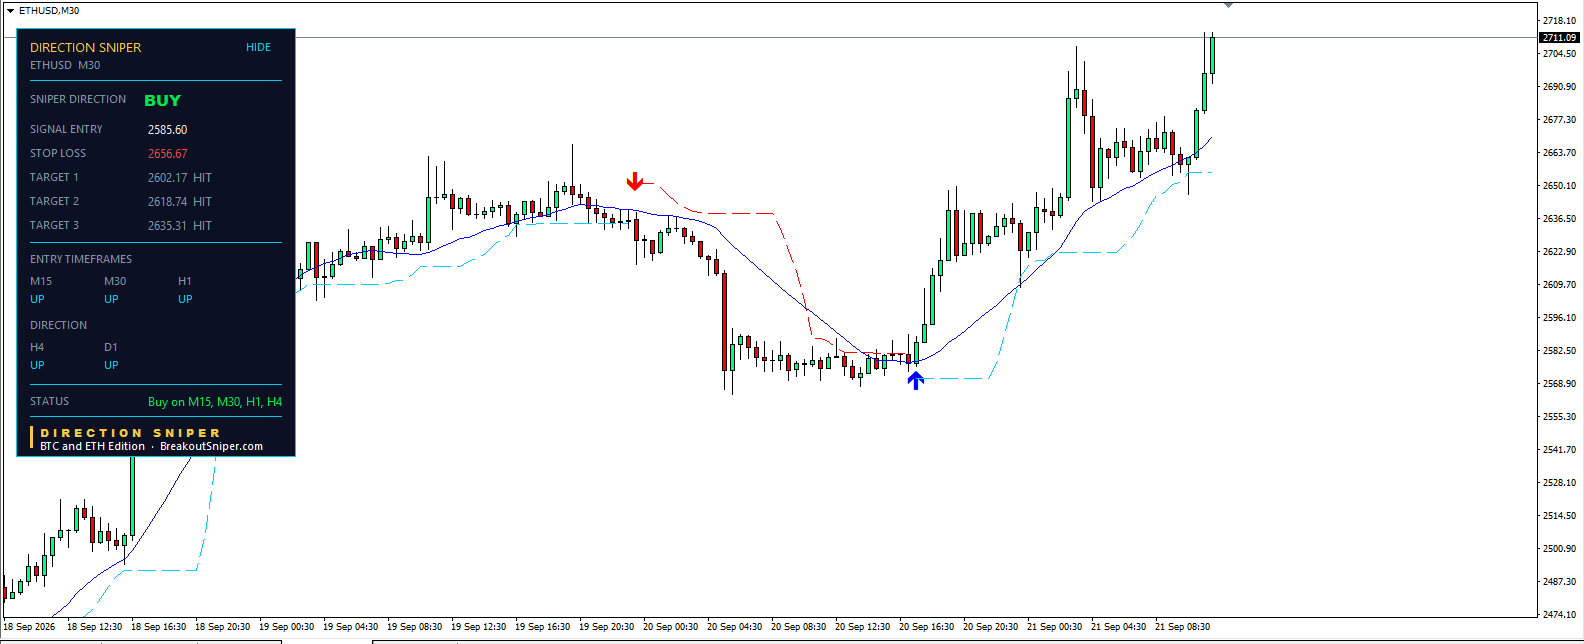
A red arrow printed on M30 late on 19 September near 2,650 and price fell to around 2,580. A blue arrow followed around 16:30 on 20 September, and the panel built this ticket:
- Signal entry: 2,585.60
- Stop at entry: around 2,569
- Target 1: 2,602.17, marked HIT
- Target 2: 2,618.74, marked HIT
- Target 3: 2,635.31, marked HIT
The targets sit about 16.6 points apart. Price is now at 2,711.09 and the trailing level reads 2,656.67, above the entry.
The M15 ticket, still running
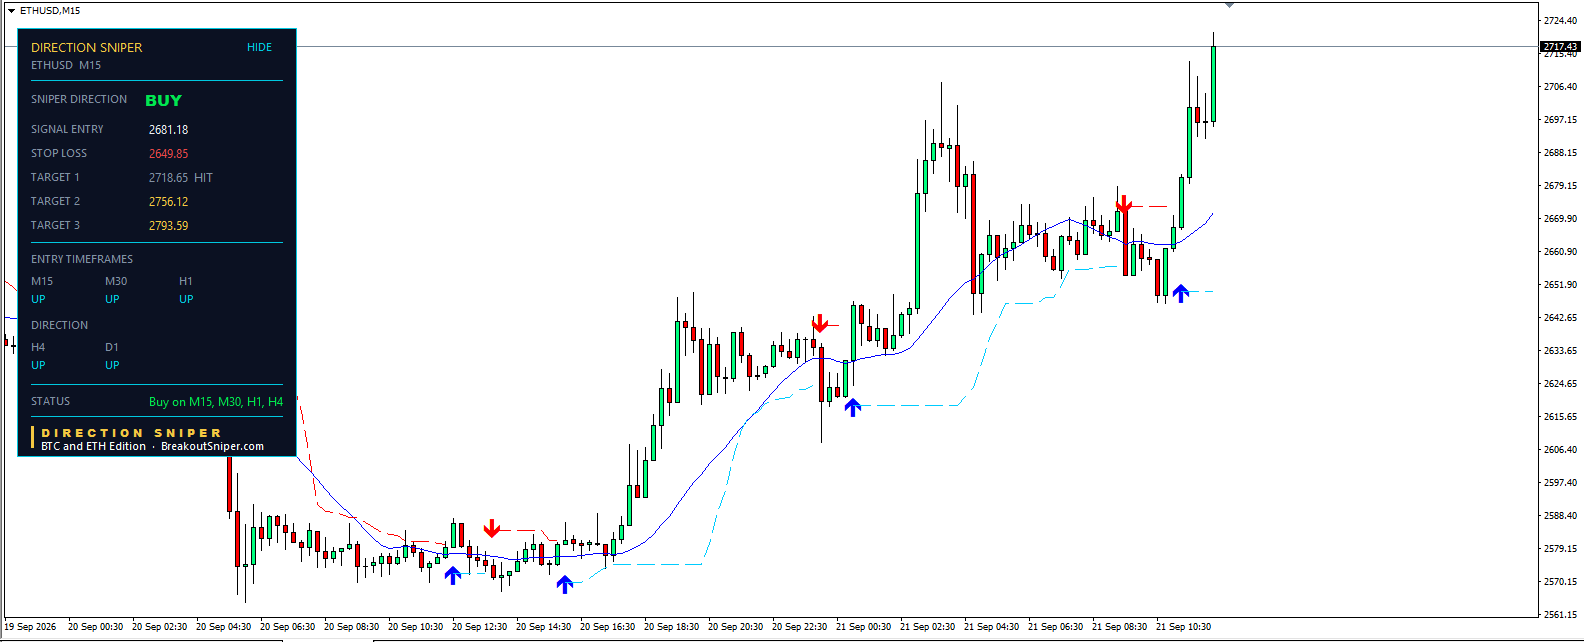
This one is live, and it is the more useful of the two to look at.
A red arrow printed on M15 around 08:30 on 21 September, then a blue arrow followed roughly an hour later in the direction of the verdict:
- Signal entry: 2,681.18
- Stop loss: 2,649.85, still below entry
- Target 1: 2,718.65, marked HIT
- Target 2: 2,756.12, not reached
- Target 3: 2,793.59, not reached
Price is at 2,717.43. Target 1 was touched on the high of a candle, Targets 2 and 3 have not been reached, and the stop is still below the entry price.
We are publishing this one unfinished on purpose. Two of today’s tickets look clean because they are already complete. This one shows what a ticket actually looks like while it is live: one target reached, two outstanding, and an outcome that is not yet decided. Most of the time you spend in a trade looks like this, not like a finished panel.
What Changes the Picture
Bitcoin and Ethereum are reading identically. On both, the first thing to watch is the first timeframe to disagree with the verdict.
On Ethereum, a drop below the M15 stop at 2,649.85 would end the live ticket. A return below the early September high near 2,680 would put the breakout in question. If the H4 turns down, the verdict becomes NO TRADE on both coins and the panel stands aside.
The Lesson: The Wait Is Part of the Method
Yesterday the panel on both coins said BUY with almost nothing agreeing underneath it. One fast chart up, two down, and no ticket anywhere. Anyone reading it wanted something to do, and there was nothing to do.
That is the part of this method that feels like a flaw and is actually the point.
The direction was correct yesterday. It was correct the day before. What was missing was timing, and there is no way to get timing early. You either wait for an entry timeframe to turn, or you buy before it does and hope. Buying before it turns is how traders end up long during a pullback with no idea how deep it goes.
Notice what the entry prices on today’s tickets tell you. Bitcoin’s H1 signal came in at 80,678, below where price had been trading for most of the previous week. Ethereum’s M30 signal came in at 2,585, also below the recent range. Both tickets were built during the pullback that made yesterday’s panel look so unhelpful.
That is not a coincidence. The signals arrive at the end of the pullback, not at the start of it, because the indicator waits for the fast chart to turn back in the direction of the verdict. The uncomfortable, nothing-to-do stretch and the entry are the same event, seen one day apart.
And this is the part that matters if you were watching.
You did not have to be at your desk for any of it. The alert fires on the bar close that produces the signal, which is the same moment the ticket appears on the panel. Anyone with push notifications switched on had Bitcoin’s H1 signal on their phone at 80,678, and Ethereum’s M30 signal at 2,585, while both coins were still in the pullback and the charts still looked weak.
That is the whole gap between watching a market and catching a move. Not analysis, not conviction, just being told the moment the entry timeframe agreed with the direction. Bitcoin went on to 84,443 and Ethereum to 2,711 in the hours that followed. Someone who acted on the alert was positioned before that happened. Someone who was waiting for the chart to look good was not, because by the time a chart looks good the entry is behind you.
The alert does not know what will happen next. It fires on the tickets that reach their targets and on the tickets that hit the stop, because it is reporting a signal, not a forecast. What it does is remove the one thing you cannot solve by trying harder: being at the screen at the exact minute the market turns.
The honest caveat: this worked out today. Some tickets hit the stop before Target 1, and one of today’s three is still running with two targets outstanding. Waiting properly does not guarantee the trade works. It only guarantees you are not buying before the market has finished falling.
The direction tells you where to look. The entry tells you when to act. The alert tells you the moment it happens. Yesterday only the first of those was ready. Today all three were.
Trade ticket levels are indicator output, shown for education, not a recommendation to trade. The completed tickets shown are examples selected after they finished and are not typical or guaranteed results. Educational analysis, not financial advice. Trading carries risk and you can lose money.
