Bitcoin And Ethereum Price Forecast Today, 21 November 2026: Both Are Rallying, But Direction Sniper Says Not Yet
This Bitcoin price forecast today starts with a finished ticket. The 4 hour sell from 75,952.45 on 5 November reached Target 1 and Target 2, and closed at its trailing stop 10,675 points in front of the entry. Bitcoin then kept falling, to about 55,500, roughly 27 percent below that entry. Today Bitcoin and Ethereum are both rallying hard. It looks like a turn. It is not one yet. The 4 hour and the daily still read DOWN on both. Here is the whole story, and what we wait for next.
Targets 1 and 2 · About +1.47R
🛡 Closed at trailing stop: 65,276.67, 10,675.78 points in front of the entry.
Now: 15 minute, 30 minute and 1 hour UP. 4 hour and daily still DOWN.
Stand on a beach when the tide is going out.
Every few seconds, a wave runs up the sand. Some run a long way. Watch only one wave, and you would swear the sea is coming back in.
It is not. Each wave stops a little lower than the one before. You only see the tide if you watch where the waves stop, not how far they run.
That is Bitcoin and Ethereum this weekend. A big wave is running up the beach. By the end of section 5, you will see what tells us the tide has not turned, and what would.
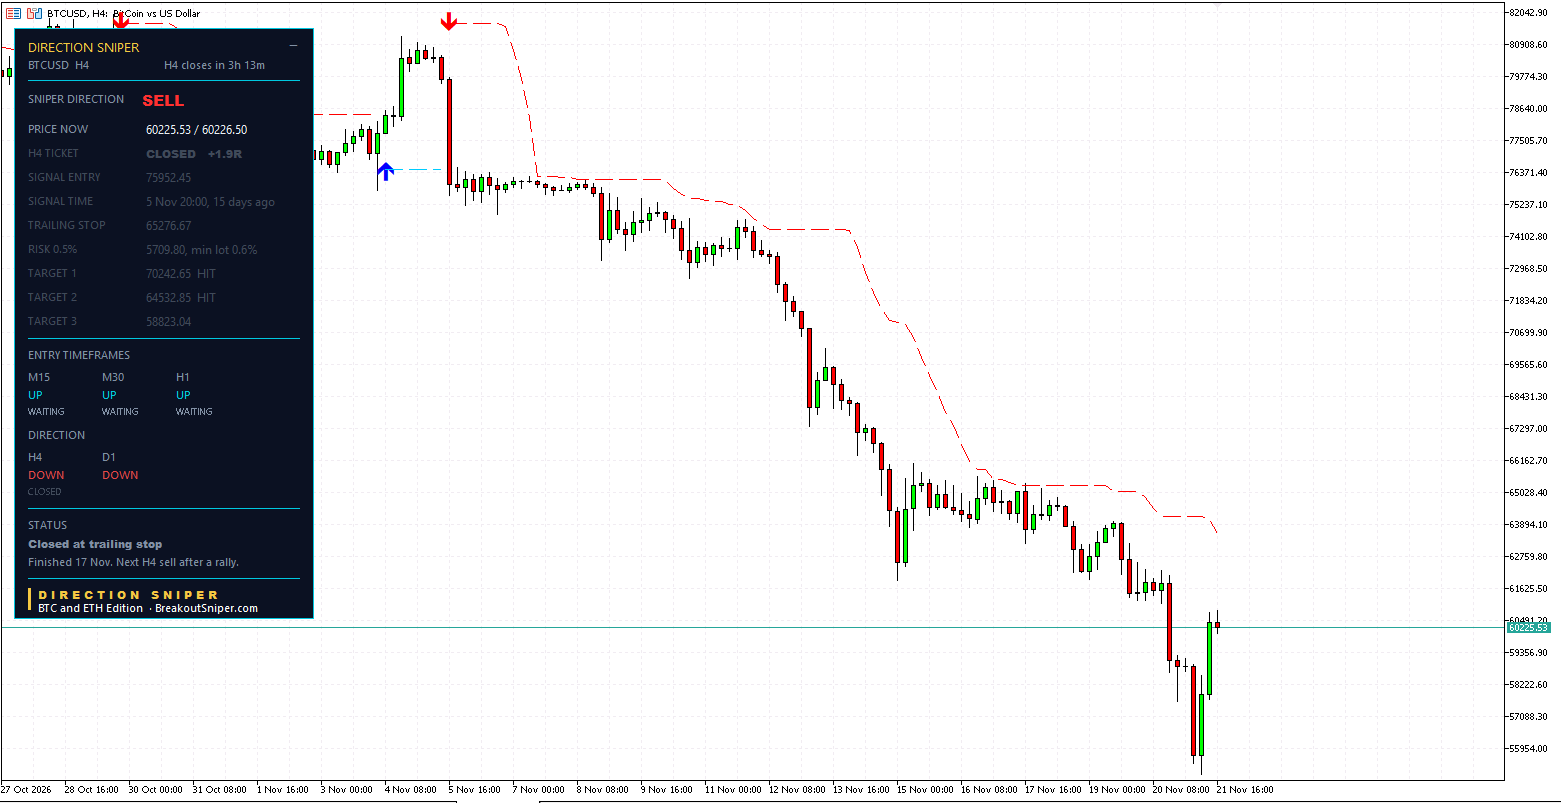
1. The 4 Hour: Target 1 And Target 2 Reached
In our Bitcoin price forecast on 14 November, this ticket had reached Target 1 and was still running. Target 2 was still ahead, 2,572 points away. Here is how it finished.
The 4 hour sell printed at 20:00 on 5 November at 75,952.45.
| Level | Distance from entry | |
|---|---|---|
| Original stop | 81,662.25 | 5,709.80 points |
| Target 1 | 70,242.65 | 5,709.80 points, reached |
| Target 2 | 64,532.85 | 11,419.60 points, reached |
| Target 3 | 58,823.04 | 17,129.41 points |
| Closed at trailing stop | 65,276.67 | 10,675.78 points in front |
Target 1 came first, as Bitcoin broke down through 70,000. That is the moment the ticket changed character: under our partial exit model, half of it closed at Target 1, one full risk in front. From there, the worst the rest could do was close near level.
Target 2 came on 15 November, when Bitcoin dropped hard through 65,000 toward 62,000. That is twice the original risk. By then, 80 percent of the ticket had closed at a target, and the trailing stop had moved far in front of the entry.
On 17 November, a bounce reached the trailing stop at 65,276.67 and closed the last part of the ticket, 10,675.78 points in front of the entry. That is almost twice the original risk again, on the part that did not reach a target.
Put together under our model: half at Target 1, 30 percent at Target 2, and the last 20 percent at the trailing stop. That is about +1.47R. Not one part of this ticket closed behind its entry.
Then Bitcoin kept falling without it, to about 55,500, through the level of Target 3. The trailing stop is not there to catch the last point of a move. It is there so that a ticket that has reached two targets cannot hand them back. It did that job.
The month on Bitcoin, on the panel:
| Ticket | Targets reached | How it ended | Result under our model |
|---|---|---|---|
| 4 hour, 5 November | 2 of 3 | Closed at trailing stop, in front | about +1.47R |
| 1 hour, 12 November | 3 of 3 | All targets reached | +1.70R |
| 30 minute, 13 November | 2 of 3 | Closed at trailing stop, in front | about +1.36R |
| 15 minute, 13 November | 2 of 3 | Closed at trailing stop, in front | about +1.13R |
Four tickets on four timeframes, one direction, and every one closed in front.
2. Bitcoin Now: The Wave Running Up The Beach
Bitcoin bottomed near 55,500 and has bounced to about 60,225, almost 4,700 points in a day.
On the panel, that rally shows clearly. The 15 minute, 30 minute and 1 hour all read UP. But the 4 hour and the daily still read DOWN. The status says it plainly: next 4 hour sell after a rally.
So the panel is not reading a turn. It is reading a rally inside a fall that has not ended.
3. Ethereum Now: The Same Picture
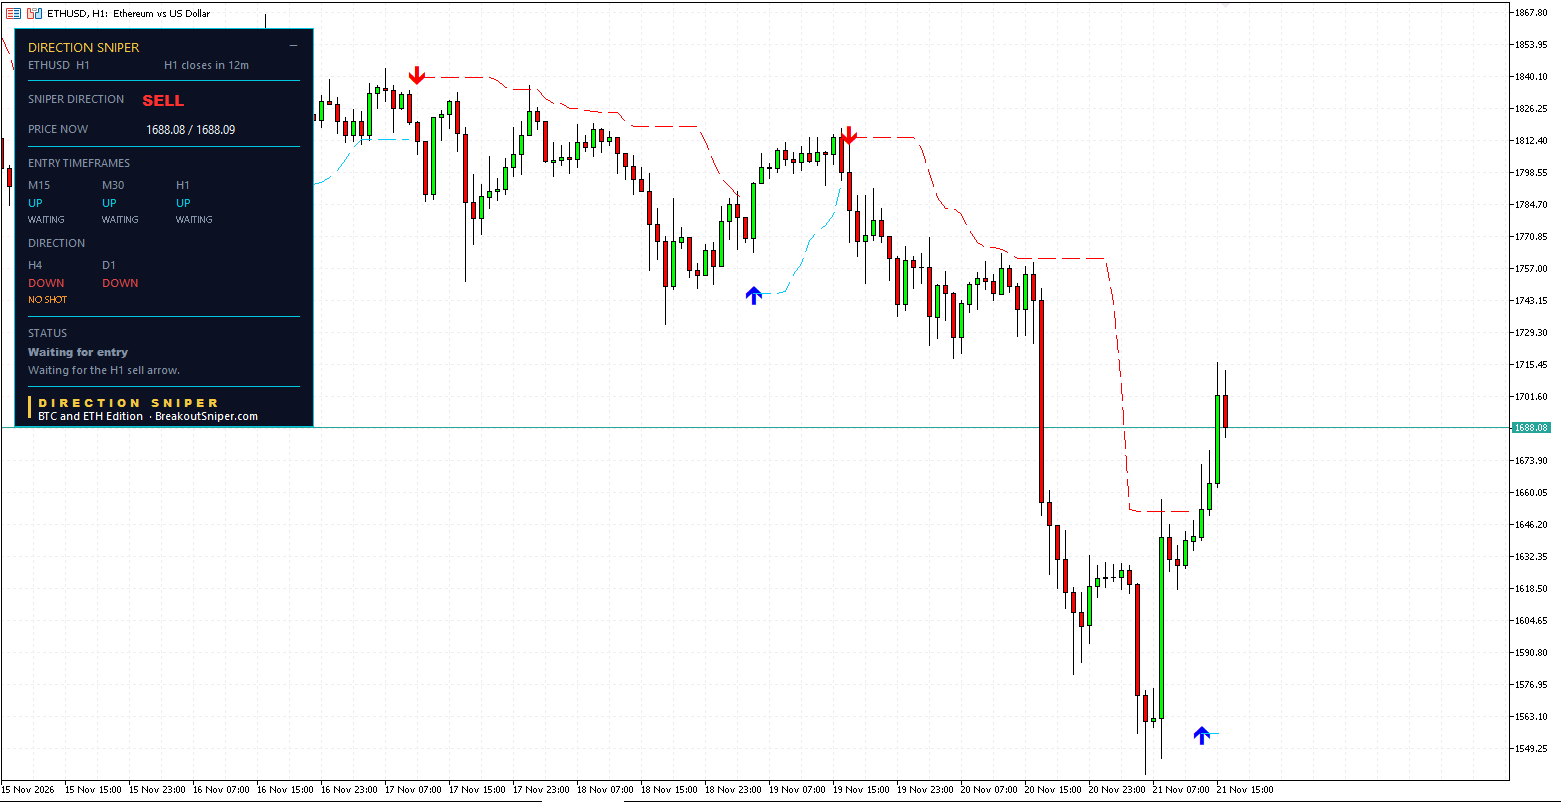
Ethereum fell from above 1,800 on 19 November to about 1,545, then rallied to about 1,688.
Same picture as Bitcoin. The 15 minute, 30 minute and 1 hour read UP. The 4 hour and the daily read DOWN. The status reads Waiting for entry: waiting for the 1 hour sell arrow. The 4 hour reads NO SHOT: its ticket fired earlier, and it is too late to take now.
One more thing on Ethereum. Our scanner marks its daily CHOPPY: it changed direction twice in the last 20 days. The direction is DOWN, but it has not proved itself as clearly as Bitcoin’s.
4. Do Not Be Fooled: A Rally Is Not A Turn
A rally like this is where most traders get caught, in one of two ways.
Some see a green day after a 27 percent fall and buy, sure the bottom is in. Others still hold a sell from far below and watch it go against them, hoping.
The panel avoids both, because it asks one question first: what do the 4 hour and the daily say? Today, on both coins, they say DOWN. Until they change, this rally is a wave, not the tide.
That does not mean Bitcoin cannot go higher. Rallies inside a fall can run a long way. It means we do not act on the small charts against the big ones.
5. What We Wait For, And What Would Change It
What we wait for: the rally to run out, and a fresh sell arrow, a 1 hour on Ethereum and a 4 hour or smaller on Bitcoin, each with its own stop and three targets. That is the same pattern that gave the 1 hour ticket on 12 November and the 15 and 30 minute tickets on 13 November.
What would change the picture:
- The 4 hour turning UP. Then the sell read ends on that coin, and we wait for the daily.
- The daily turning UP. Then the fall is over on the panel, and the tide has turned.
Until one of those happens, we stay out of the way of the rally, and we wait.
These are the levels and conditions we are watching, not trade recommendations.
6. Lot Size: Why The 4 Hour Needs A Bigger Account
We risk at most 2 percent per trade, usually 0.5 percent, so on a $10,000 account that is $50. On many brokers, one lot of BTCUSD is one Bitcoin, so each point is $1 per lot. Check your own broker’s contract size.
The 4 hour stop was 5,709.80 points. At $50 of risk, that is about 0.009 lots, below the 0.01 minimum. Even 0.01 lots risks about $57, which is why the panel shows “min lot 0.6%.”
That is not a reason to risk more. It is a reason to choose the timeframe that fits your account. The smaller charts carry smaller stops, and smaller stops fit smaller accounts. For small balances we recommend a RoboForex Cent account or an XM Micro account. These are partner links, so we may receive a commission at no cost to you.
Always round down, never up. Work out your own size in seconds with our free Bitcoin Lot Size Calculator.
If you are worrying about every trade, your lot size is still too big.
Watch Where The Waves Stop
The 4 hour sell reached Target 1, then Target 2, and closed its last part almost twice its risk in front. Bitcoin fell about 27 percent from that entry. And this weekend, Bitcoin and Ethereum are both rallying, with the small charts UP and the big charts still DOWN.
It looks like a turn. Direction Sniper says not yet.
That is Direction Sniper:
- Direction. One verdict from the 4 hour and the daily. Bitcoin has read DOWN on both since 5 November, through every bounce.
- Rallies and bounces that have not broken structure. Today’s rally is the biggest yet. The bigger charts have not turned.
- The stop loss. Every ticket arrives with its stop and three targets marked, and the trailing stop protects what the targets have reached. This month, that turned a 4 hour ticket into Target 1, Target 2, and a close far in front.
The Direction Sniper BTC and ETH Edition puts this exact panel on your own Bitcoin and Ethereum charts. The direction verdict from the 4 hour and the daily. A fresh ticket the moment it prints, on the 15 minute, 30 minute, 1 hour and 4 hour, each with its entry, stop and three targets. The trailing stop level, updated as price moves. And alerts to your phone.
That last part matters most this weekend. Crypto does not wait for Monday. When this rally runs out, the next arrow could print on a Sunday, or in the middle of the night. The panel will see it. With the alert on your phone, so will you.
MT4 or MT5. While forex sleeps on Saturday and Sunday, the BTC and ETH Edition keeps watching.
Forex, gold and silver open again on Monday. Catch up on this week’s currency board in currency strength today, 20 November. Want a read like this in your inbox? Join The Daily Sniper Read, free, every trading day.
Bitcoin And Ethereum Price Forecast Today: Frequently Asked Questions
Updated 21 November 2026. Levels are as shown on the Direction Sniper panel at the time of writing.
1What is the Bitcoin price forecast today, 21 November 2026?+
Bitcoin’s 4 hour and daily still read DOWN on the Direction Sniper panel, so the direction is SELL. The 15 minute, 30 minute and 1 hour read UP as Bitcoin rallies to about 60,225.
The panel reads this as a rally inside a fall, not a turn. This is not a trade recommendation.
2Did the Bitcoin 4 hour reach Target 1 and Target 2?+
Yes. The 4 hour sell from 75,952.45 on 5 November reached Target 1 at 70,242.65 and Target 2 at 64,532.85, then closed at its trailing stop at 65,276.67 on 17 November.
That is about +1.47R under our 50/30/20 partial exit model, with no part closing behind the entry.
3Is the Bitcoin rally a reversal?+
Not yet. A turn on the panel needs the 4 hour to read UP, and then the daily. Today both still read DOWN.
Rallies inside a fall can run a long way, so we wait for it to run out and a fresh sell arrow.
4What is the Ethereum price forecast today?+
Ethereum’s 4 hour and daily read DOWN, while the 15 minute, 30 minute and 1 hour read UP as it rallies to about 1,688.
The panel is waiting for a fresh 1 hour sell arrow.
5What lot size should I use for Bitcoin?+
We risk at most 2 percent per trade, usually 0.5 percent, which is $50 on a $10,000 account. On the 4 hour stop of 5,709.80 points, that is below the 0.01 lot minimum.
Smaller charts carry smaller stops. Use the Bitcoin Lot Size Calculator and check your broker’s contract size.
6Does Direction Sniper work on weekends?+
Bitcoin and Ethereum trade every day, including weekends, and the BTC and ETH Edition reads them the same way it reads every other market.
Tickets print the moment they appear, with alerts to your phone.
DIRECTION SNIPER BTC AND ETH EDITION
See Bitcoin and Ethereum the moment a ticket prints, weekends included.
Direction, entry, stop and three targets on BTCUSD and ETHUSD. MT4 or MT5.
Disclaimer: This post reports what the Direction Sniper panel showed on BTCUSD and ETHUSD between 5 and 21 November 2026. Prices will have moved by the time you read this. It is educational analysis, not financial advice and not a trade signal service, and nothing here is a recommendation to buy or sell. These tickets were not published in advance in our daily reads, and the results are measured in R, multiples of each ticket’s original risk, using a fixed partial exit model of 50 percent at Target 1, 30 percent at Target 2 and 20 percent at Target 3. They are not the results of any trading account, and spread, commission and slippage are not included. Price reaching a target or stop level is not the same as a realised result, and a ticket shown as closed describes the panel, not anyone’s trade. High and low levels are approximate readings from the chart. Contract sizes and lot sizes are arithmetic for illustration, vary by broker, and are not a recommendation about how much anyone should trade. Past results do not guarantee future results. Cryptocurrency trading carries a high level of risk, and you should only trade money you can afford to lose.