
The Bitcoin and Ethereum price forecast for today: Bitcoin still reads BUY. The bigger timeframes, the H4 and daily, are both up. We are now waiting for the buy signals to come in on M15, M30 and H1, which have all pulled back for now. Readings as of 20 September 2026.
How to Read the Chart
The panel on the left gives the verdict. The H4 and daily set the direction, and the entry timeframes (M15, M30 and H1) are where the timing signals appear. On the chart itself, a red arrow marks where that timeframe turned down, and the red dashed line then follows price from above. A blue arrow marks a turn up, with the blue line following from below.
Bitcoin and Ethereum trade through the weekend, so Saturday and Sunday candles count toward these readings.
Bitcoin Technical Analysis Today (BTCUSD)
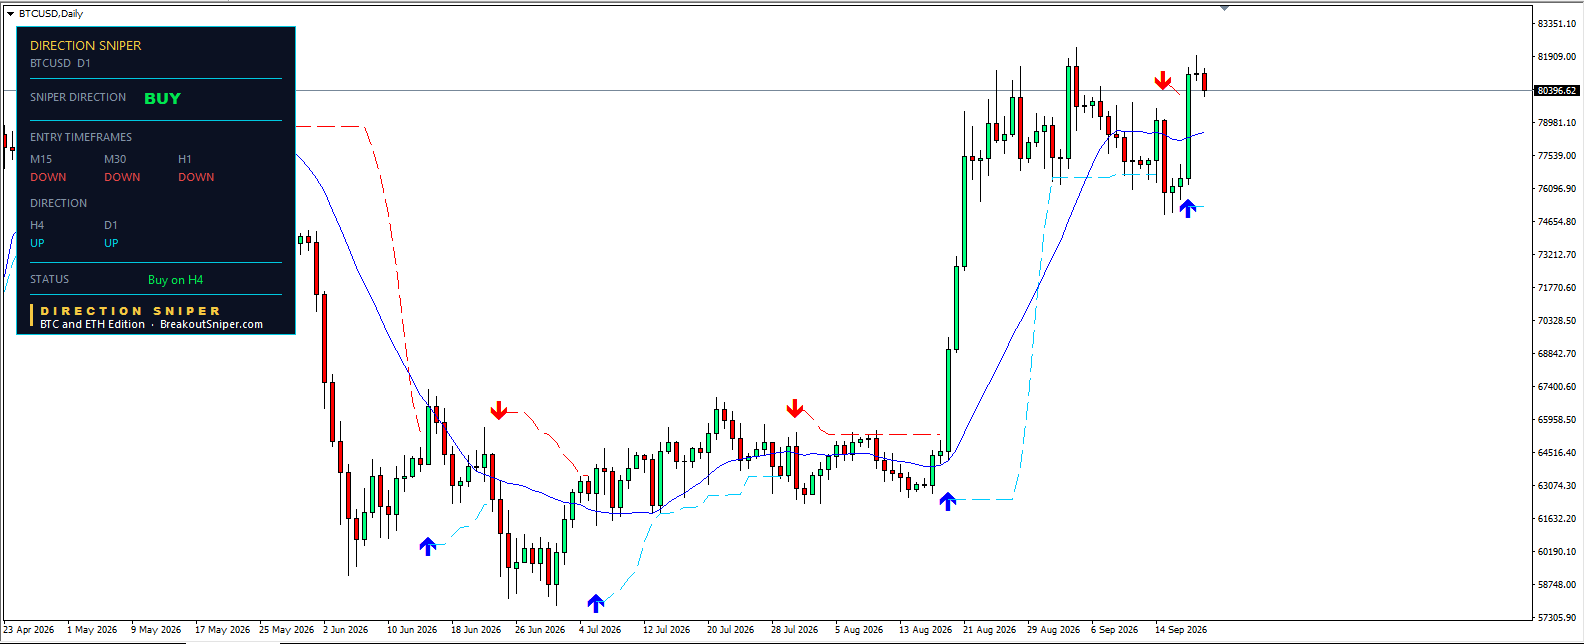
Direction Sniper reads BUY on Bitcoin. Status: Buy on H4.
The bigger timeframes are up. The H4 and daily both read UP, so the direction is set. What we are waiting for now is the buy signal on the entry timeframes. M15, M30 and H1 all read DOWN for the moment, so none of them has given that signal yet.
Price is at 80,396.62.
A Buy Verdict With No Entry
This is the reading that confuses most traders. The panel says BUY, so why is there nothing to do?
Because the verdict and the entry are two different questions. The verdict answers which way. The entry timeframes answer when. Right now the answer to the first question is up, and the answer to the second is not yet.
All three fast charts have turned down together. That is a pullback, and the panel is showing it honestly. It is not telling you to sell, because the H4 and daily have not moved. It is not telling you to buy either, because nothing on the entry timeframes agrees yet.
So there is no ticket yet. The bigger timeframes are up, and we are waiting for the buy signals from M15, M30 and H1. The moment one of them turns back up while the H4 and daily are still up, a ticket appears on that timeframe. Until then, the job is to wait.
Where Price Is Sitting
Yesterday Bitcoin pushed up to around 81,900 and closed red. That puts it right back under the top of the range it has held since late August, which runs from roughly 75,000 to 82,300.
Every push into the 81,000 to 82,300 area since then has been turned back. Today’s pullback on the fast charts is happening in exactly the same place.
The Daily Chart Puts It in Perspective
On the daily, the signals earlier in the year each held for weeks. A blue arrow in mid June, a red arrow shortly after, a blue arrow in early July, a red arrow in late July, and a blue arrow in mid August that started the jump from around 64,000 to 77,500.
Then September changed the rhythm. A red arrow printed in mid September near the range top, and a blue arrow followed within days near 75,500. Two daily signals in under a week is what a range does to a signal tool. Price moves up and down without going anywhere, and each swing is big enough to register.
That is why the H4 and daily verdict matters more than any single arrow. For the Bitcoin price forecast, the verdict is still BUY and the range is still intact. The bigger picture points up. The timing has not arrived.
What Changes the Picture
If M15, M30 or H1 turns back up while the H4 and daily stay up, a buy ticket appears on that timeframe. A daily close above around 82,300 would take Bitcoin out of its range for the first time since late August. A move below the dynamic trend line near 78,700 would put price back in the middle of the range. If the H4 turns down, the verdict becomes NO TRADE and the panel stands aside completely.
About the panel: These readings come from the Direction Sniper panel, Bitcoin and Ethereum Edition, which shows the direction on the 4 hour and daily charts and the entry timeframes for BTCUSD and ETHUSD on MetaTrader 4 and MT5. It was built and tuned on gold and silver, and the crypto edition has not been separately tested on crypto.
Ethereum Technical Analysis Today (ETHUSD)
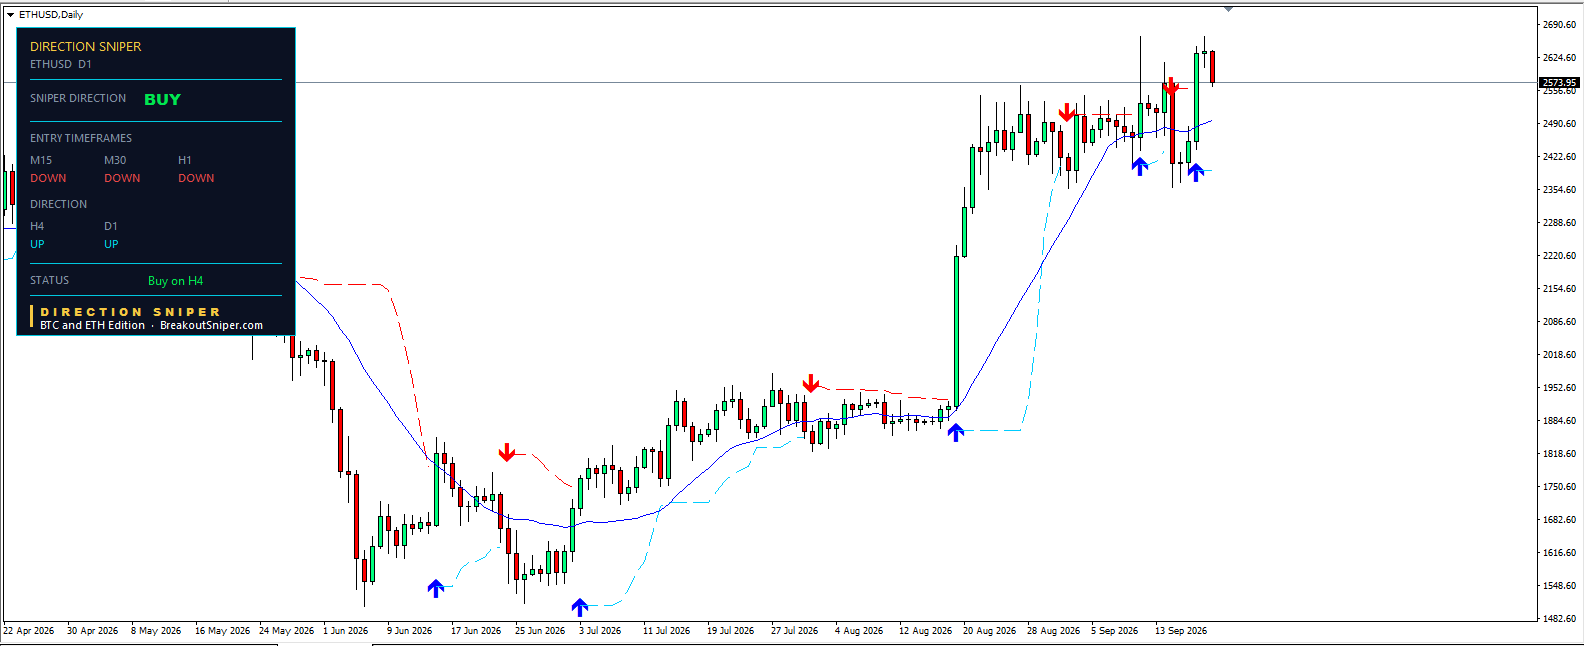
Ethereum reads the same as Bitcoin, field for field. BUY, status Buy on H4.
The bigger timeframes are up. The H4 and daily both read UP. M15, M30 and H1 all read DOWN, so here too we are waiting for the buy signals on the entry timeframes.
Price is at 2,573.95.
Ethereum Broke Out, Then Came Back to Test It
The difference between the two coins is where the pullback is happening.
Bitcoin never left its range. It pushed up to the top and got turned back. Ethereum did leave. Yesterday it closed above the top of its range for the first time in weeks, reaching around 2,660. Today it has given back most of that push and is sitting at 2,573.95, just above the old range top near 2,560.
That makes 2,560 the level that matters for Ethereum right now. A market that breaks out of a range often comes back to test the level it broke. If that level holds, the old ceiling becomes the new floor. If it fails, the breakout was a false one and price is back inside the range.
The panel does not guess which one it will be. It shows a BUY verdict from the bigger timeframes and a pullback on the fast ones, and it waits for M15, M30 or H1 to turn back up.
The Daily Chart Tells the Same Story
Ethereum’s year looks like Bitcoin’s. Signals from June to August each held for weeks, and the blue arrow in mid August started the jump from around 1,900 to 2,450 in a few candles.
September has been different. Ethereum has printed four daily arrows this month alone, sell, buy, sell, buy, as price swung between roughly 2,400 and 2,560. That is the range at work again. The most recent daily arrow is a blue one near 2,390 in mid September, and the verdict has read BUY since.
What Changes the Picture
If M15, M30 or H1 turns back up while the H4 and daily stay up, a buy ticket appears on that timeframe. If Ethereum holds above around 2,560, the breakout above the range stays intact. A daily close back below 2,560 puts price back inside the range, with the dynamic trend line near 2,500 as the next level below. A move above the early September spike high near 2,680 would take Ethereum to its highest level in this run. If the H4 turns down, the verdict becomes NO TRADE and the panel stands aside.
Two coins, same reading, same instruction: the bigger timeframes are up, and we wait for the buy signals.
The Lesson: The Verdict Is Not an Entry
A BUY verdict feels like permission. The panel says up on both coins, the charts have been rising for a month, and the urge is to get in now before they run.
But look at what the fast charts are doing. On both coins, all three have turned down together. Buying here means buying into a pullback with no idea how deep it goes. On Bitcoin, that pullback is happening right under a level that has turned price back every time since August. On Ethereum, it is testing whether yesterday’s breakout was real.
Direction and timing are separate jobs. The H4 and daily tell you which side of the market you are allowed to be on. The entry timeframes tell you when that side is actually moving. A trader who only reads the first is guessing on the second.
Most losing trades in an uptrend are not wrong on direction. They are early. They buy the pullback before it is finished, get stopped out, and then watch the market go up without them.
Direction Sniper removes that decision. The verdict can say BUY for days, and no ticket appears until an entry timeframe agrees. When it shows nothing, it is not missing the move. It is refusing to buy the dip before the dip is done.
The bigger timeframes are up. The buy signals on M15, M30 and H1 have not come yet. Today, the job is to wait for them.
Educational analysis, not financial advice. Trading carries risk and you can lose money.
