
The gold and silver price forecast today: gold shows a potential change in direction. The 4 hour has turned up, all three entry timeframes are up, and only the daily is still pointing down. The panel reads NO TRADE until those two agree. Readings as of 18 September 2026.
How to Read the Chart
The panel on the left gives the verdict. The H4 and daily set the direction, and the entry timeframes (M15, M30 and H1) are where the timing signals appear. On the chart itself, a red arrow marks where that timeframe turned down, and the red dashed line then follows price from above. A blue arrow marks a turn up, with the blue line following from below.
Gold Technical Analysis Today (XAUUSD)
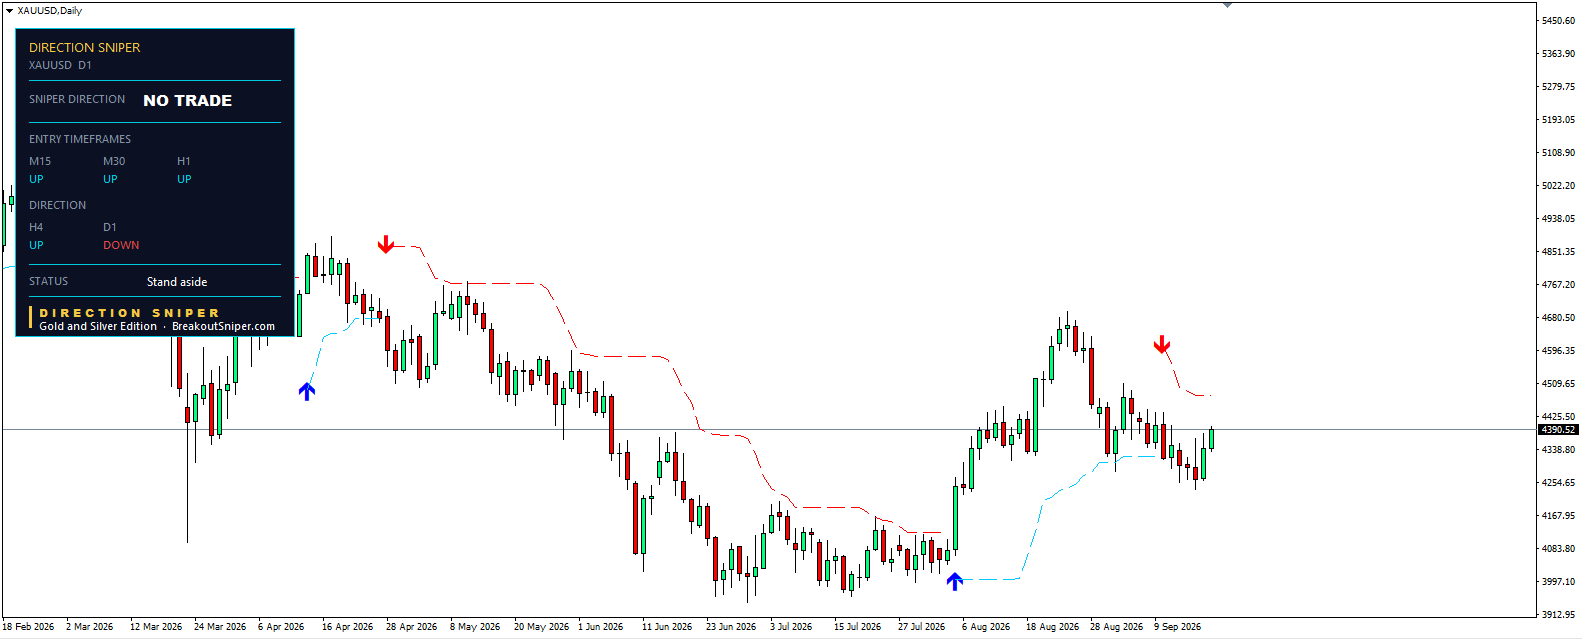
Direction Sniper reads NO TRADE on gold. Status: stand aside.
The H4 has turned UP while the daily still reads DOWN. The two direction timeframes disagree, so the panel will not name a direction at all. All three entry timeframes, M15, M30 and H1, read UP.
Price is at 4,390.52, up roughly 100 points from yesterday morning.
What a Potential Change in Direction Looks Like
Five of the six timeframes the panel reads are now pointing up. The M15, M30, H1 and the H4. Only the daily is still down.
That is the shape a real direction change takes. It builds from the fast charts upward, and the daily is always the last to turn.
But look at this week before deciding it is happening.
Wednesday: NO TRADE, the H4 had turned up and the daily was down.
Thursday: SELL, the H4 turned back down after the Fed decision.
Friday: NO TRADE, the H4 is up again.
The H4 has flipped three times in three sessions. The daily has not moved once. It has read DOWN since the red arrow in early September near 4,650.
So this is the second time this week the panel has shown the same potential change, and the first one reversed within a day. Price has spent two weeks moving sideways between roughly 4,250 and 4,400, and inside a range like that the 4 hour will keep changing its mind.
A potential change becomes a real one when the daily turns. Until then it is a possibility the panel is showing you, not a direction it is giving you.
The Daily Chart Puts It in Perspective
On the daily, none of this week registers at all.
Four signals all year: the blue arrow in late March near 4,400, the red arrow in mid April near 4,900, the blue arrow in early August near 4,000, and the red arrow in early September near 4,650. Each one lasted weeks or months.
That is the timeframe the panel trusts to set direction, and it is the one that has not moved while everything faster than it has flipped repeatedly.
What This Kind of Week Is For
Nothing.
That is not a joke. When the H4 flips every session and the daily will not move, there is no edge in either direction, and the panel says so by refusing to name one. Three of the last four sessions have ended in stand aside, or in a direction that reversed the next day.
The mistake most traders make in a week like this is to keep trading it. Every bounce looks like a setup on the fast charts, and each one gets taken because doing nothing feels like missing out.
The panel removes that decision. If the H4 and daily do not agree, there is no ticket on any timeframe, and that is the end of it.
What Changes the Picture
Gold has no direction until the H4 and daily agree again. If the daily turns up, gold flips to a BUY with all three entry timeframes already pointing that way. If the H4 turns back down, the SELL setup resumes for the third time this week.
About the panel: These readings come from the Direction Sniper panel, which shows the direction on the 4 hour and daily charts and the entry timeframes for Gold and Silver on MetaTrader 4 and MT5.
Silver Price Forecast Today (XAGUSD)
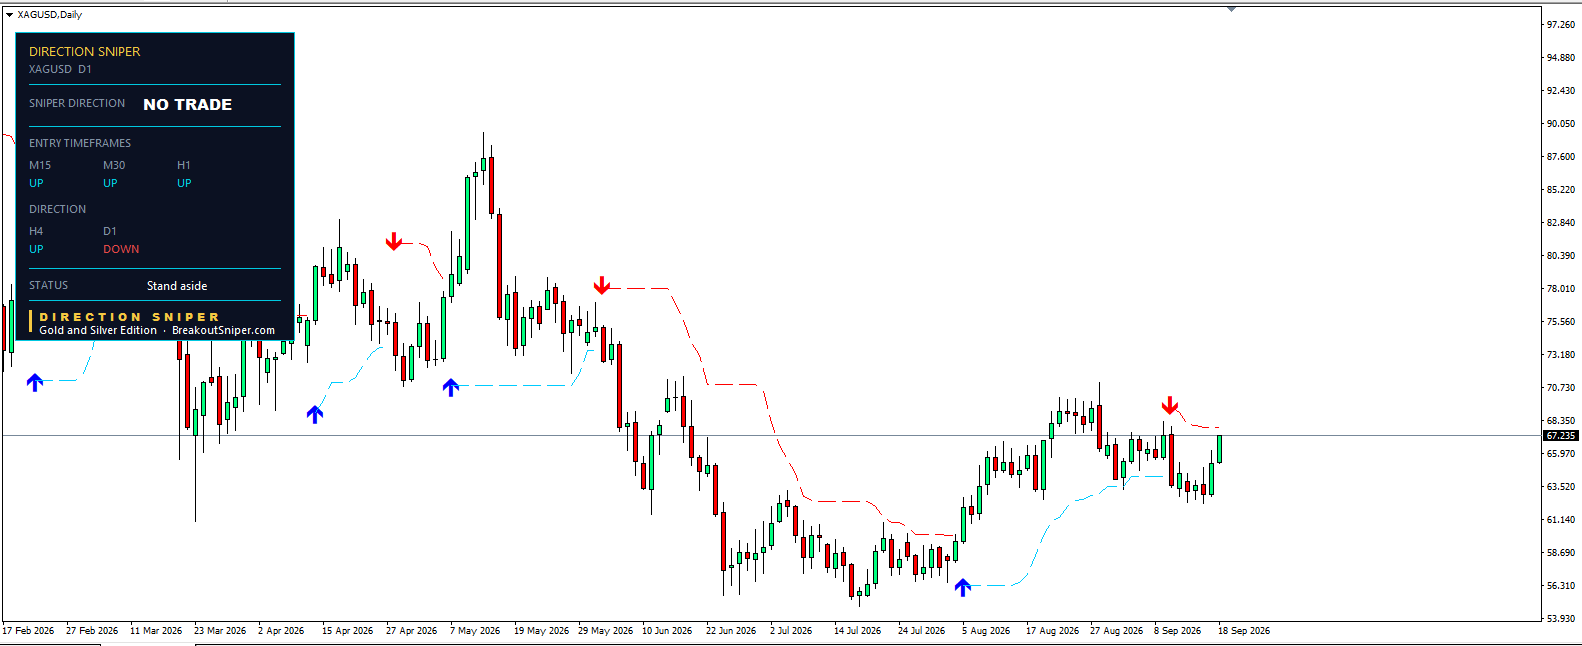
Silver reads the same as gold, field for field. NO TRADE, status stand aside.
The H4 has turned UP, the daily still reads DOWN, and all three entry timeframes read UP. Every field matches gold’s panel exactly.
Price is at 67.235.
Silver’s move has been the larger of the two. It has come up from about 62.40 on Monday to 67.24 today, close to where the early September red arrow printed near 68. Gold in the same period went from roughly 4,300 to 4,390.
So silver has travelled further back toward its last daily signal than gold has. That does not change the reading, because the daily has not turned on either metal, but it is worth noticing which one is pushing harder against the trend.
The daily chart shows the same structure as gold. Six signals across the year: blue arrows in February near 72, late March near 71, and early August near 56, and red arrows in late April near 82, late May near 78, and early September near 68. Every one lasted weeks.
Both metals are now showing the same potential change in direction, and on both it is the daily that has to move before it counts.
What Changes the Picture
Gold and silver are reading identically today. Neither has a direction until its H4 and daily agree again.
If the daily turns up on either metal, it flips to a BUY with all three entry timeframes already pointing that way. If the H4 turns back down, the SELL setup resumes for the third time this week.
Two metals, same reading, same instruction: stand aside.
The Lesson: Cash Is a Position
Three sessions this week. Three different verdicts. Wednesday said stand aside. Thursday said sell. Friday says stand aside again.
Anyone who traded each of those signals got whipsawed twice. Not because the readings were wrong, but because the market had not decided anything yet, and trading an undecided market is how accounts bleed out in small cuts rather than one big loss.
Here is what most traders never learn: cash is a position.
Not a waiting room. Not the absence of a decision. A position, with its own return, which in a week like this one is zero, and zero beats what the whipsawed traders got.
The market spends most of its time going nowhere. Real trends are rare. The money is made in the few stretches where the timeframes agree and the move runs, and it is lost in the long stretches between, when every bounce looks like the start of something and none of them are.
That is what a transition looks like from the inside. Not a clean turn. A fast chart flipping every session while the slow chart refuses to move. You cannot trade that. You can only wait for it to resolve, and the only way to wait properly is to be in cash while you do it.
This is the strength of Direction Sniper.
Most tools are built to find you something to trade. Ask them a question and they will always have an answer, because a tool that goes quiet feels broken to the person who paid for it.
Direction Sniper does the opposite. When the 4 hour and the daily disagree, it refuses to name a direction, and no ticket appears on any timeframe. It has said NO TRADE on both metals for most of this week, and that was the correct output every single day.
It is not being unhelpful when it says stand aside. It is doing the hardest part of the job, which is stopping you from acting when there is nothing worth acting on. A tool that only ever says buy or sell cannot do that for you, and neither can you, on your own, at seven in the morning with a chart in front of you and the urge to do something.
The daily has not turned. Until it does, there is nothing here.
Being flat is a decision. Make it deliberately.
