
The gold and silver price forecast today: Direction Sniper still shows gold in a downtrend on the 4 hour and daily, but the picture underneath has flipped. Yesterday the 15 and 30 minute charts were pointing down with the trend. Today both point up, and the hourly is the only entry timeframe still in line. Readings as of 15 September 2026.
How to Read the Chart
The panel on the left gives the verdict. The H4 and daily set the direction, and the entry timeframes (M15, M30 and H1) are where the timing signals appear. On the chart itself, a red arrow marks where that timeframe turned down, and the red dashed line then follows price from above. A blue arrow marks a turn up, with the blue line following from below.
Gold Technical Analysis Today (XAUUSD)
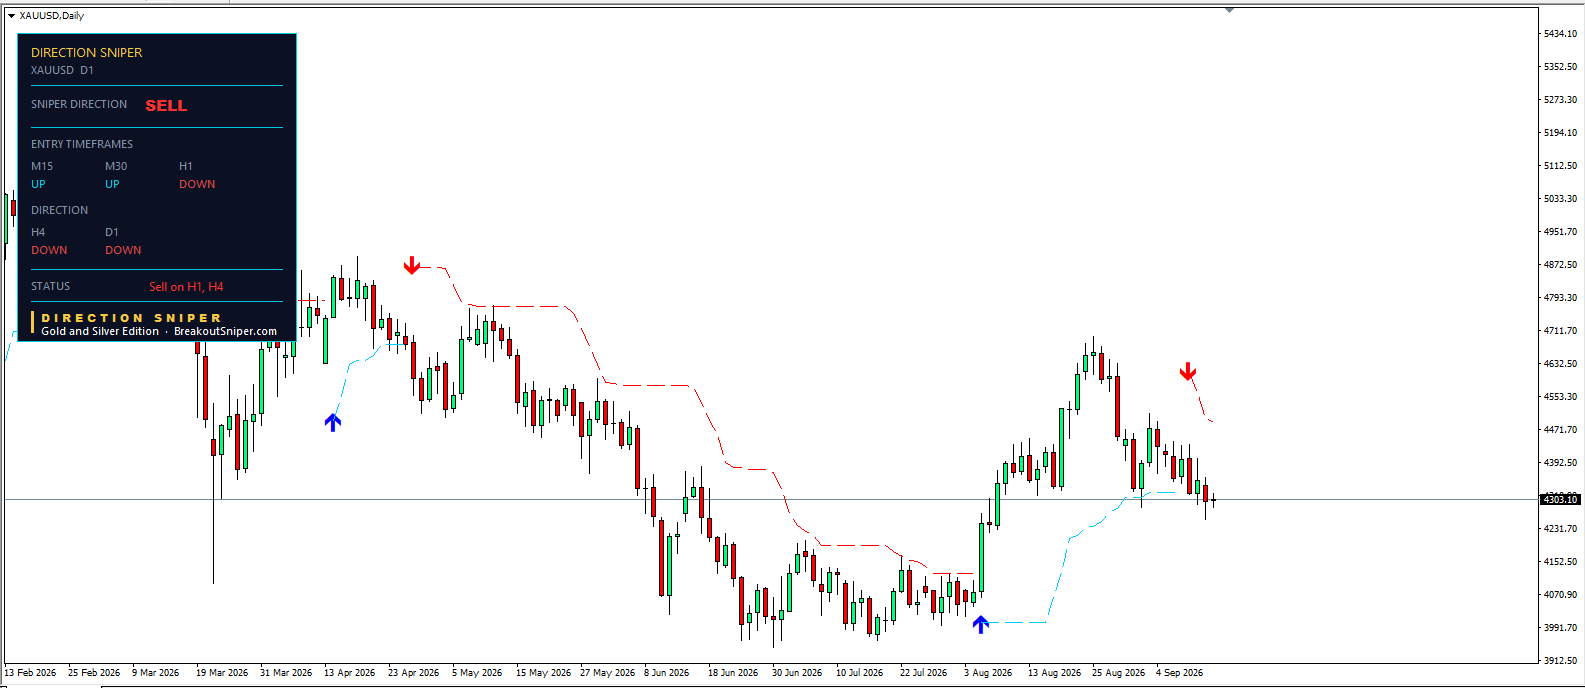
Direction Sniper shows gold in a downtrend. The H4 and daily both read DOWN, and the verdict is SELL.
Among the entry timeframes, the M15 and M30 have both turned UP. Only the H1 still reads DOWN, which is why the status line shows “Sell on H1, H4.”
Price is at 4,303.10.
This is worth sitting with, because it is the situation most traders get wrong. The fast charts are moving up while the direction charts still point down. The panel is not confused. It is telling you the two are disagreeing, which is exactly what a bounce inside a downtrend looks like from the inside. Yesterday the M15 and M30 were in line and the H1 was the odd one out. Today it has swapped.
On the daily chart, none of this registers. The red arrow from early September near 4,600 is still the last signal, and the red dashed line is still tracking price from above. Price has come down from about 4,680 in late August to 4,303 today. Zoom out further and the year shows only a handful of turns: the blue arrow in late March near 4,250, the red arrow in late April near 4,870, the blue arrow in early August near 4,000, and the red arrow in early September. Four signals in seven months.
That contrast is the point. The faster the timeframe, the more it changes its mind. The daily has moved four times this year. The M15 has moved twice since yesterday morning.
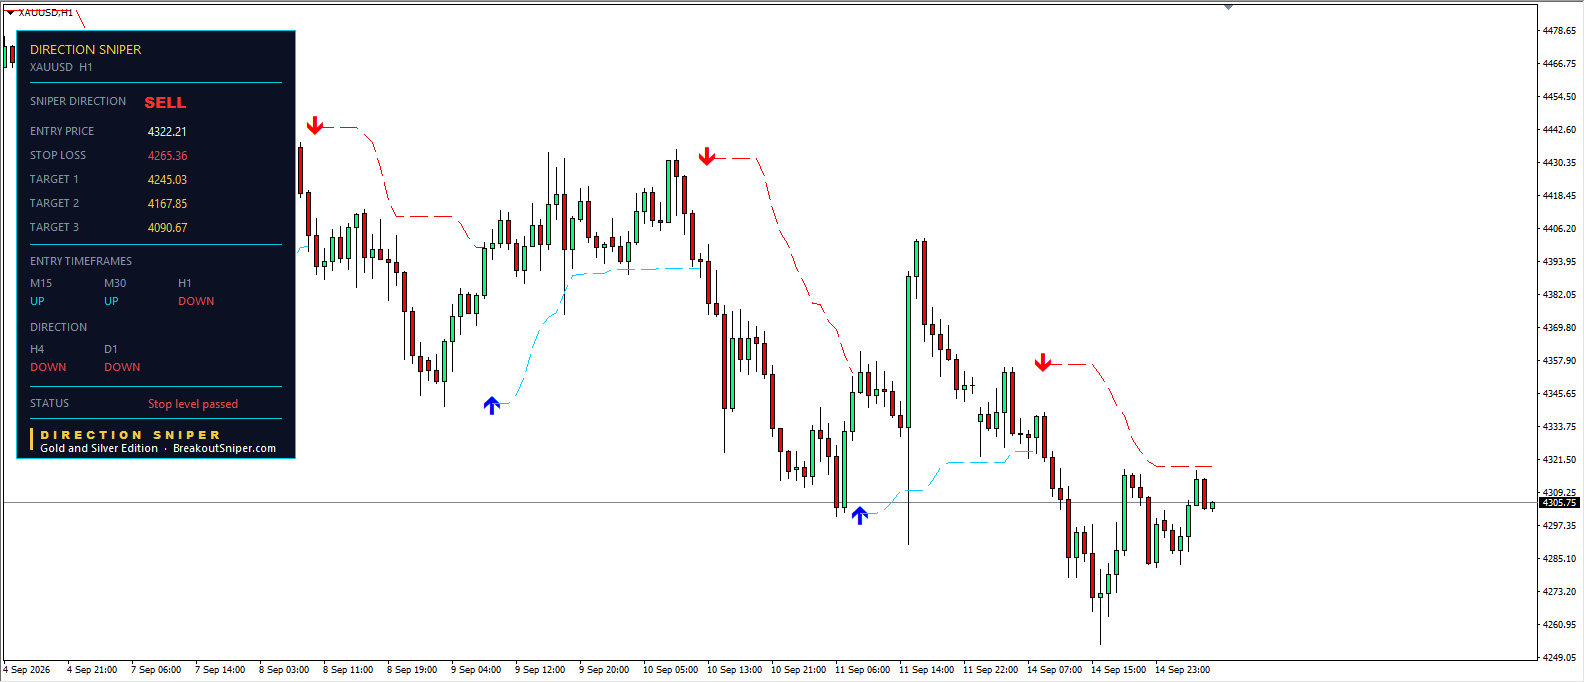
The Gold Trade Ticket on H1
This is the clearest example of the trailing stop at work I have seen this week, so it is worth walking through.
The H1 printed a red sell arrow on 14 September near 4,357. The ticket opened at 4,322.21, with the three targets sitting below at 4,245.03, 4,167.85 and 4,090.67.
Gold then fell to about 4,258. As it fell, the stop line stepped down behind it, updating hour by hour. By the time the move ran out, the stop had travelled from above the entry down to 4,265.36, well below where the trade started. At that point the trade could no longer lose, because the stop was already locked in below the entry price.
Price then turned and rallied back through that line. The panel now reads “Stop level passed,” and the trade is closed at the trailing stop.
Notice what did not happen. Target 1 at 4,245.03 was never reached. Gold got to about 4,258, roughly 13 short of it. A fixed target order would still be sitting there unfilled while price is now back at 4,305. The trailing stop did not need the target to be hit. It followed price down, and then closed the trade when price came back.
That is the trade off. A trailing stop gives up the exact target in exchange for taking what the move actually gave. Sometimes the move keeps going and you wish you had held for Target 3. Sometimes, like here, the move stops short and the trailing line is the reason the trade closed where it did.
Where the Next Signal Would Come From
With the H1 trade closed, the question is where the next one appears.
The H4 and daily still read DOWN, so the direction has not changed. What has changed is the fast charts. The M15 and M30 have both turned UP on this rally back to 4,305, which is why no new ticket is showing. A sell ticket only prints when an entry timeframe turns down in line with the direction, and right now neither of them is pointing that way.
So the next signal on gold would come from the M15 or the M30 rolling back over. The H1 has already had its turn and closed out, and it will not print a fresh sell arrow until it cycles up and back down again.
That is the practical use of the panel this morning. You are not watching for a price level. You are watching three fields on the panel, waiting for M15 or M30 to flip from UP to DOWN while H4 and D1 stay DOWN. The moment one of them does, the ticket appears on that chart with its entry, trailing stop and three targets already calculated.
If instead the H4 flips up, the direction itself has changed and none of this applies.
A Direction Sniper user reading this at the open already knows two things: which two charts to have open, and what would have to happen on them. That is the whole job of the panel. It does not tell you the market will fall. It tells you what has turned and what has not.
Gold H1 Trade: How It Closed
| Signal | Red sell arrow, H1, 14 Sep near 4,357 |
| Entry | 4,322.21 |
| Targets | 4,245.03 / 4,167.85 / 4,090.67 |
| Lowest reached | About 4,258 |
| Trailing stop finished at | 4,265.36 |
| Closed by | Trailing stop, not a target |
| Move captured | About 57 points in favour |
Target 1 was never reached. Gold came within roughly 13 points of it and turned. A fixed target order would still be open right now, with price back at 4,305. The trailing stop took what the move actually gave.
Silver Price Forecast Today (XAGUSD)
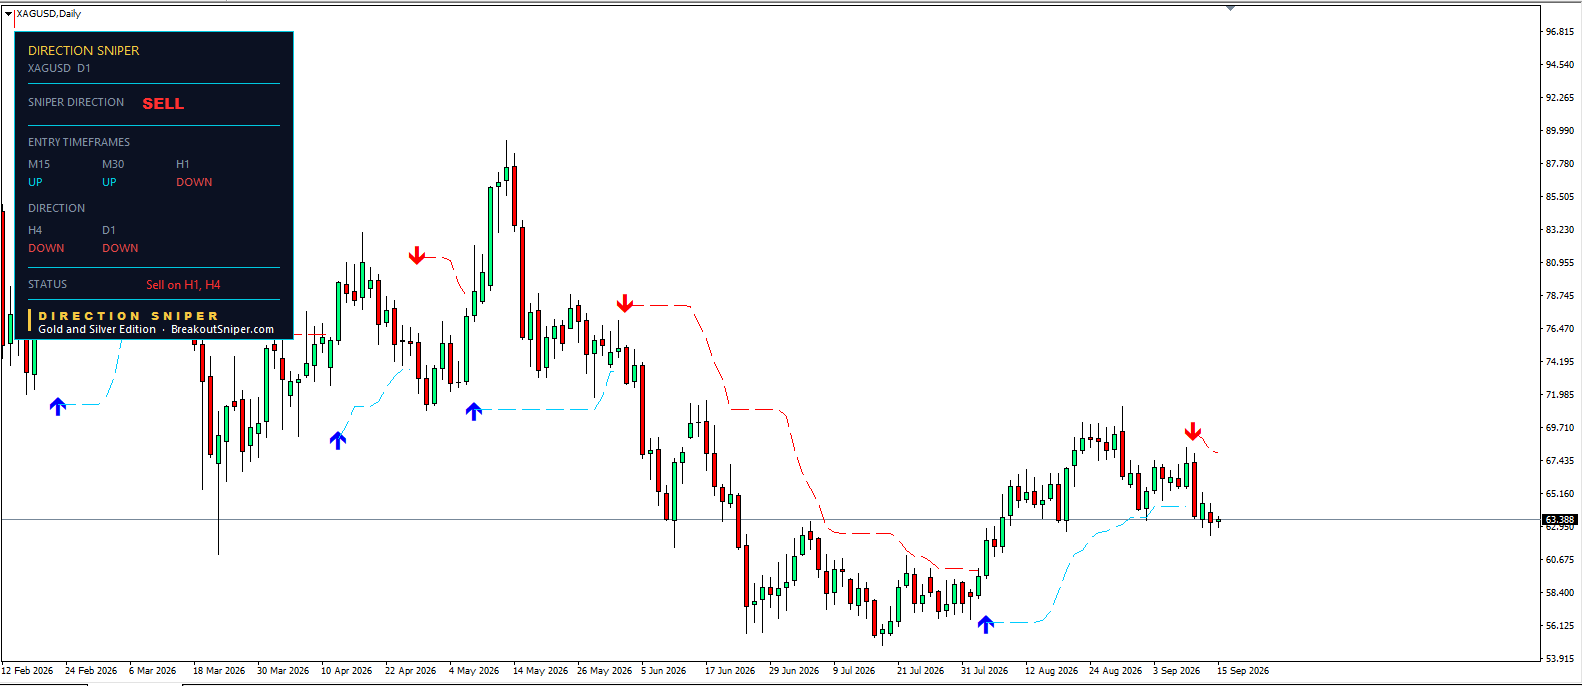
Silver is showing the same picture as gold, field for field. The H4 and daily both read DOWN, the M15 and M30 have both turned UP, and only the H1 still reads DOWN.
The status line is the same: “Sell on H1, H4.”
Price is at 63.888.
The daily chart tells the longer story. The blue arrow in late March near 71 started a run to about 88 by mid May. The red arrow in late May near 78 turned it down, and the red line tracked price through June and into July, all the way to about 56. The blue arrow at the end of July turned it back up to roughly 70 in late August. The newest red arrow, in early September near 69, flipped it down again, and that is the signal setting today’s direction.
Five signals in seven months. Like gold, the daily has barely moved while the fast charts have flipped twice since yesterday.
Because both metals are reading the same way, the same thing applies on silver. No ticket is showing, and the next one would come from the M15 or the M30 turning back down while the H4 and daily stay down.
Days like this are why the panel covers both metals on one licence. Sometimes gold and silver disagree, and you get two separate opportunities. Today they agree completely, so you are watching the same four fields on two charts.
What Changes the Picture
Gold and silver are reading identically today. On both, the direction has not changed, only the timing. The M15 or M30 turning back down would bring a new ticket in line with the H4 and daily. If the H4 flips up on either metal, that metal’s downtrend read no longer holds.
The Silver Trade Ticket on H1
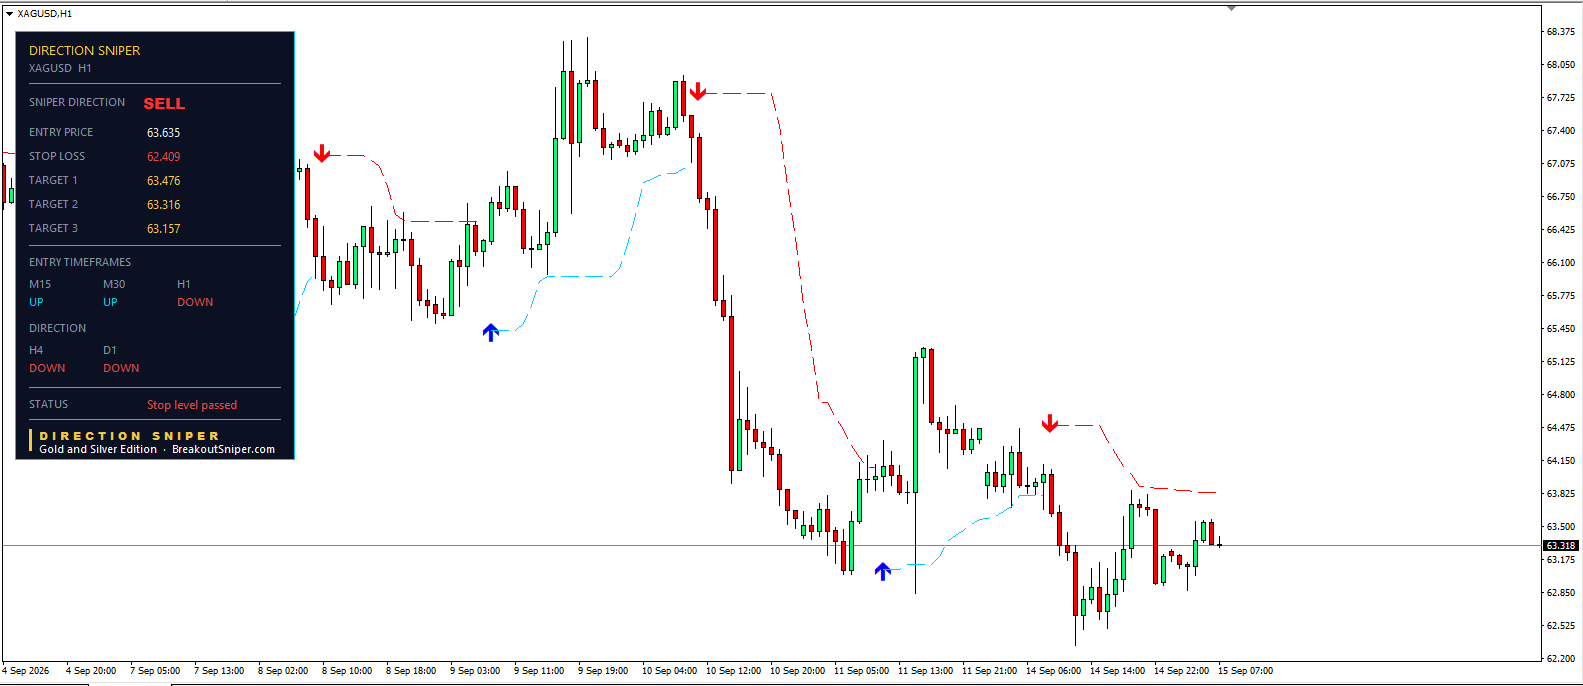
Silver is showing the same picture as gold, field for field. The H4 and daily both read DOWN, the M15 and M30 have both turned UP, and only the H1 still reads DOWN. The status line is the same: “Sell on H1, H4.”
Price is at 63.318.
The daily chart tells the longer story. The blue arrow in late March near 71 started a run to about 88 by mid May. The red arrow in late May near 78 turned it down, and the red line tracked price through June and into July, all the way to about 56. The blue arrow at the end of July turned it back up to roughly 70 in late August. The newest red arrow, in early September near 69, flipped it down again, and that is the signal setting today’s direction.
Five signals in seven months. Like gold, the daily has barely moved while the fast charts have flipped twice since yesterday.
Silver’s Hourly Trade Reached All Three Targets
Silver’s H1 printed a red sell arrow on 14 September near 64.50. The ticket opened at 63.635, with targets at 63.476, 63.316 and 63.157.
Silver then fell to about 62.40. On the way down it traded through Target 1, then Target 2, then Target 3, with room to spare below the last one.
That is the opposite of what happened on gold this morning. Gold turned roughly 13 points short of its first target and needed the trailing stop to close it in profit. Silver reached every target on the ticket.
Neither outcome was predictable when the arrows printed. That is the reason the panel gives you three targets and a trailing stop rather than one fixed exit. Some moves stop short. Some run further than the ticket asks for.
Where the Next Signal Would Come From
Both hourly trades are now finished, so the same question applies to both metals.
The H4 and daily still read DOWN on gold and silver, so the direction has not changed. What has changed is the fast charts. The M15 and M30 have turned UP on both, which is why no new ticket is showing anywhere.
The next signal would come from the M15 or the M30 rolling back over. The H1 has had its turn on both metals and will not print a fresh sell arrow until it cycles up and back down again.
So the job this morning is simple. Two charts per metal, M15 and M30, and one thing to watch: a field flipping from UP to DOWN while H4 and D1 stay DOWN. The moment it does, the ticket appears on that chart with its entry, trailing stop and three targets already calculated.
If instead the H4 flips up on either metal, the direction itself has changed and none of this applies.
Silver H1 Trade: How It Closed
| Signal | Red sell arrow, H1, 14 Sep near 64.50 |
| Entry | 63.635 |
| Targets | 63.476 / 63.316 / 63.157 |
| Lowest reached | About 62.40 |
| Targets hit | All three |
| Closed at | Target 3, 63.157 |
Silver went straight through all three targets on the way down to 62.40.
Two trades, same indicator, same morning, opposite results. Gold fell short of its first target and needed the trailing stop to close it. Silver reached its third target with room to spare. Neither outcome was predictable in advance, which is why the panel gives you a trailing stop and three targets rather than one fixed exit.
What Changes the Picture
Gold and silver are reading identically today. On both, the direction has not changed, only the timing. The M15 or M30 turning back down would bring a new ticket in line with the H4 and daily. If the H4 flips up on either metal, that metal’s downtrend read no longer holds.
Want the same panel on your own charts?
Everything in this post came from one indicator reading four timeframes at once on two metals. No extra charts, no manual levels, no guessing which timeframe to trust.
Direction Sniper is a one time purchase, and it covers both gold and silver. See how it works and get your copy here.
Update: Both Metals Fired on the M15
This post went up saying the next signal would come from the M15 or the M30 rolling back over. A few hours later, both metals did exactly that on the 15 minute chart.
Gold
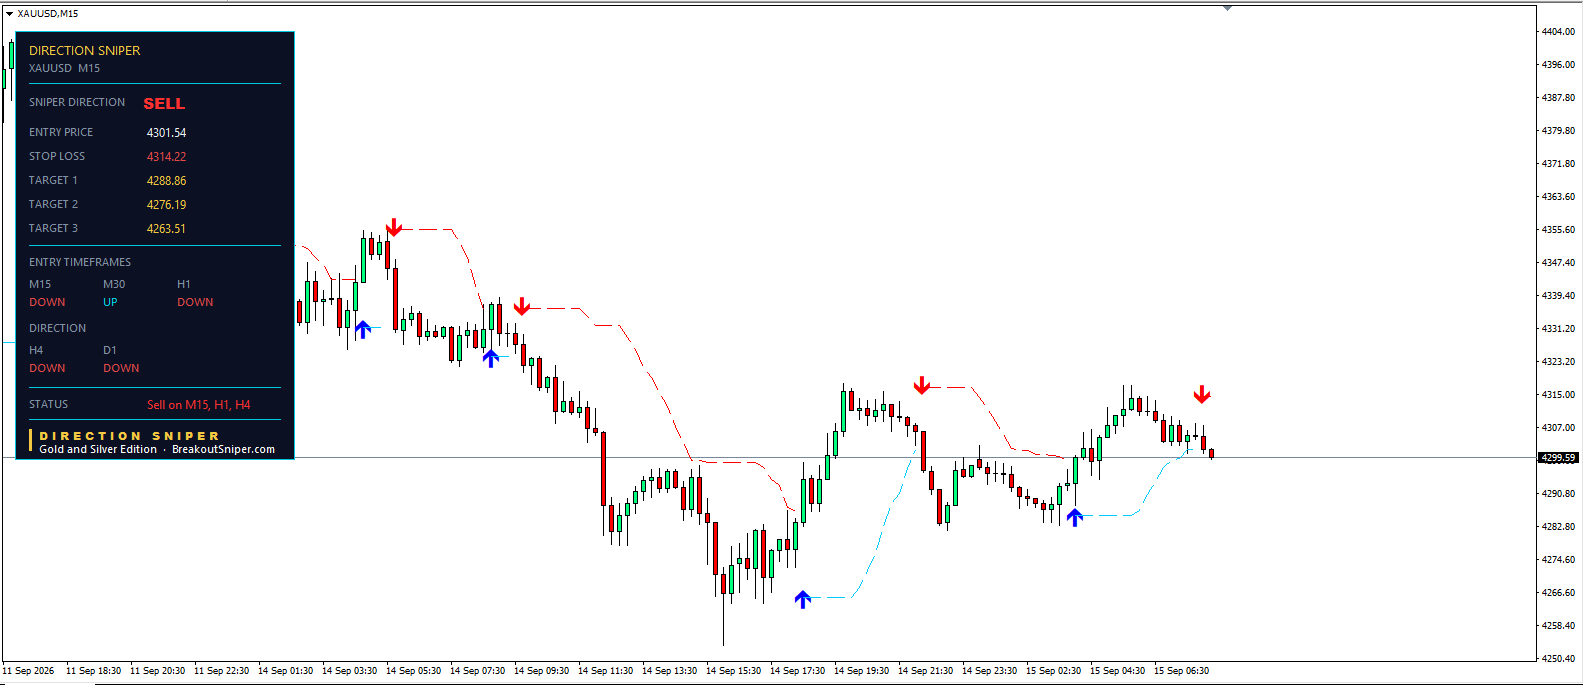
The panel now reads M15 DOWN, M30 UP, H1 DOWN, with H4 and daily still DOWN. The status line has changed to “Sell on M15, H1, H4.”
The ticket:
Entry price: 4,301.54
Stop loss: 4,314.22
Target 1: 4,288.86
Target 2: 4,276.19
Target 3: 4,263.51
The stop sits about 12.7 above the entry, and the three targets step down in equal 12.7 increments. Price is at 4,299.59, just below the entry.
Compare this to the H1 ticket that closed this morning. That one had targets spread about 77 apart, all the way down to 4,090. This M15 ticket asks for a fraction of that, with Target 3 only 38 below the entry. Same indicator, same direction, different timeframe, and the whole scale of the ticket changes with it. A faster chart expects a smaller move, so it sets a tighter stop and closer targets.
Silver
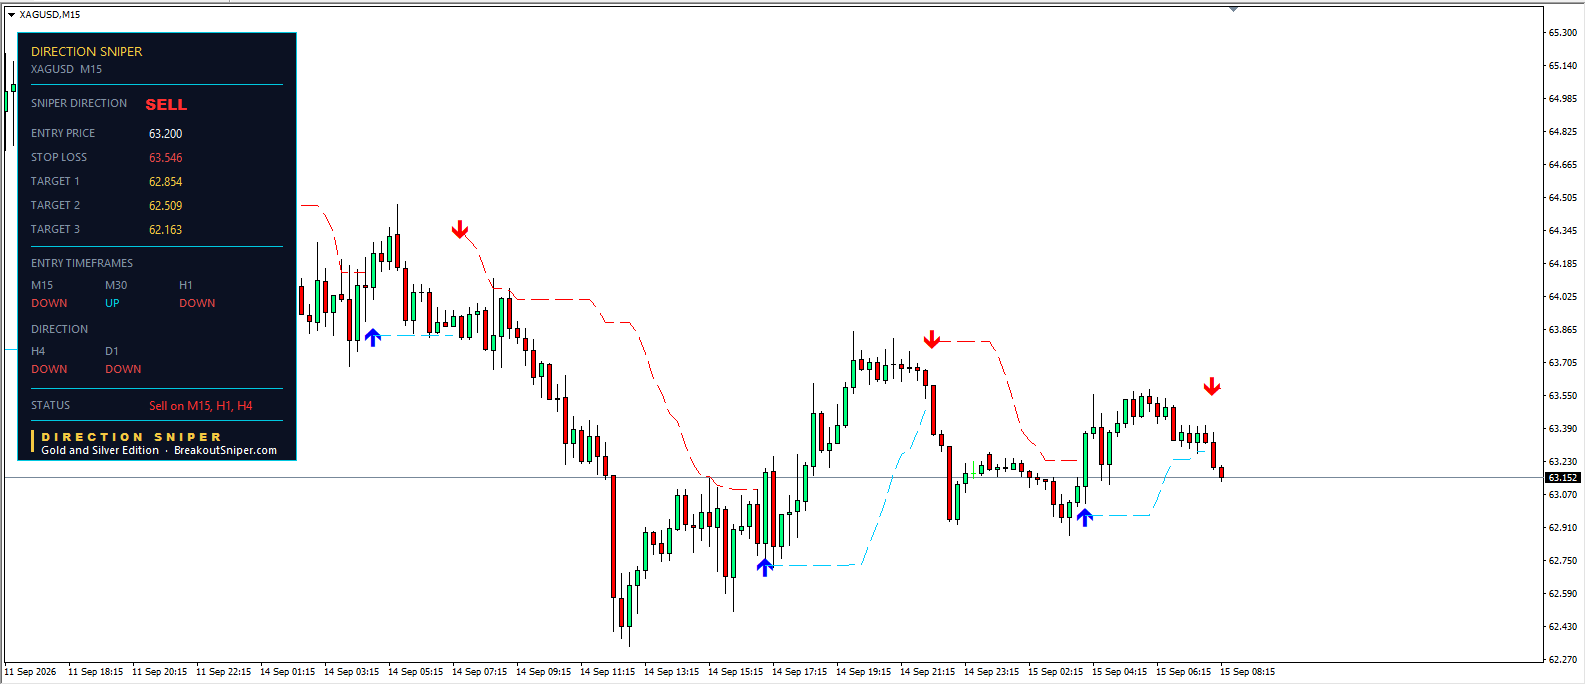
Silver printed the same setup. M15 DOWN, M30 UP, H1 DOWN, H4 and daily DOWN, status “Sell on M15, H1, H4.”
The ticket:
Entry price: 63.200
Stop loss: 63.546
Target 1: 62.854
Target 2: 62.509
Target 3: 62.163
The stop sits about 0.35 above the entry, with the targets stepping down in the same 0.35 increments. Price is at 63.177, just below the entry.
What Actually Happened Today
Nothing about the direction changed. The H4 and daily read DOWN this morning and they read DOWN now. All that happened is that one entry timeframe on each metal finished its bounce and turned back in line, which is the exact event this post was watching for.
That is what the panel is for. It does not predict. It tells you which timeframes have turned, so you know what you are waiting for and you recognise it when it arrives.
